
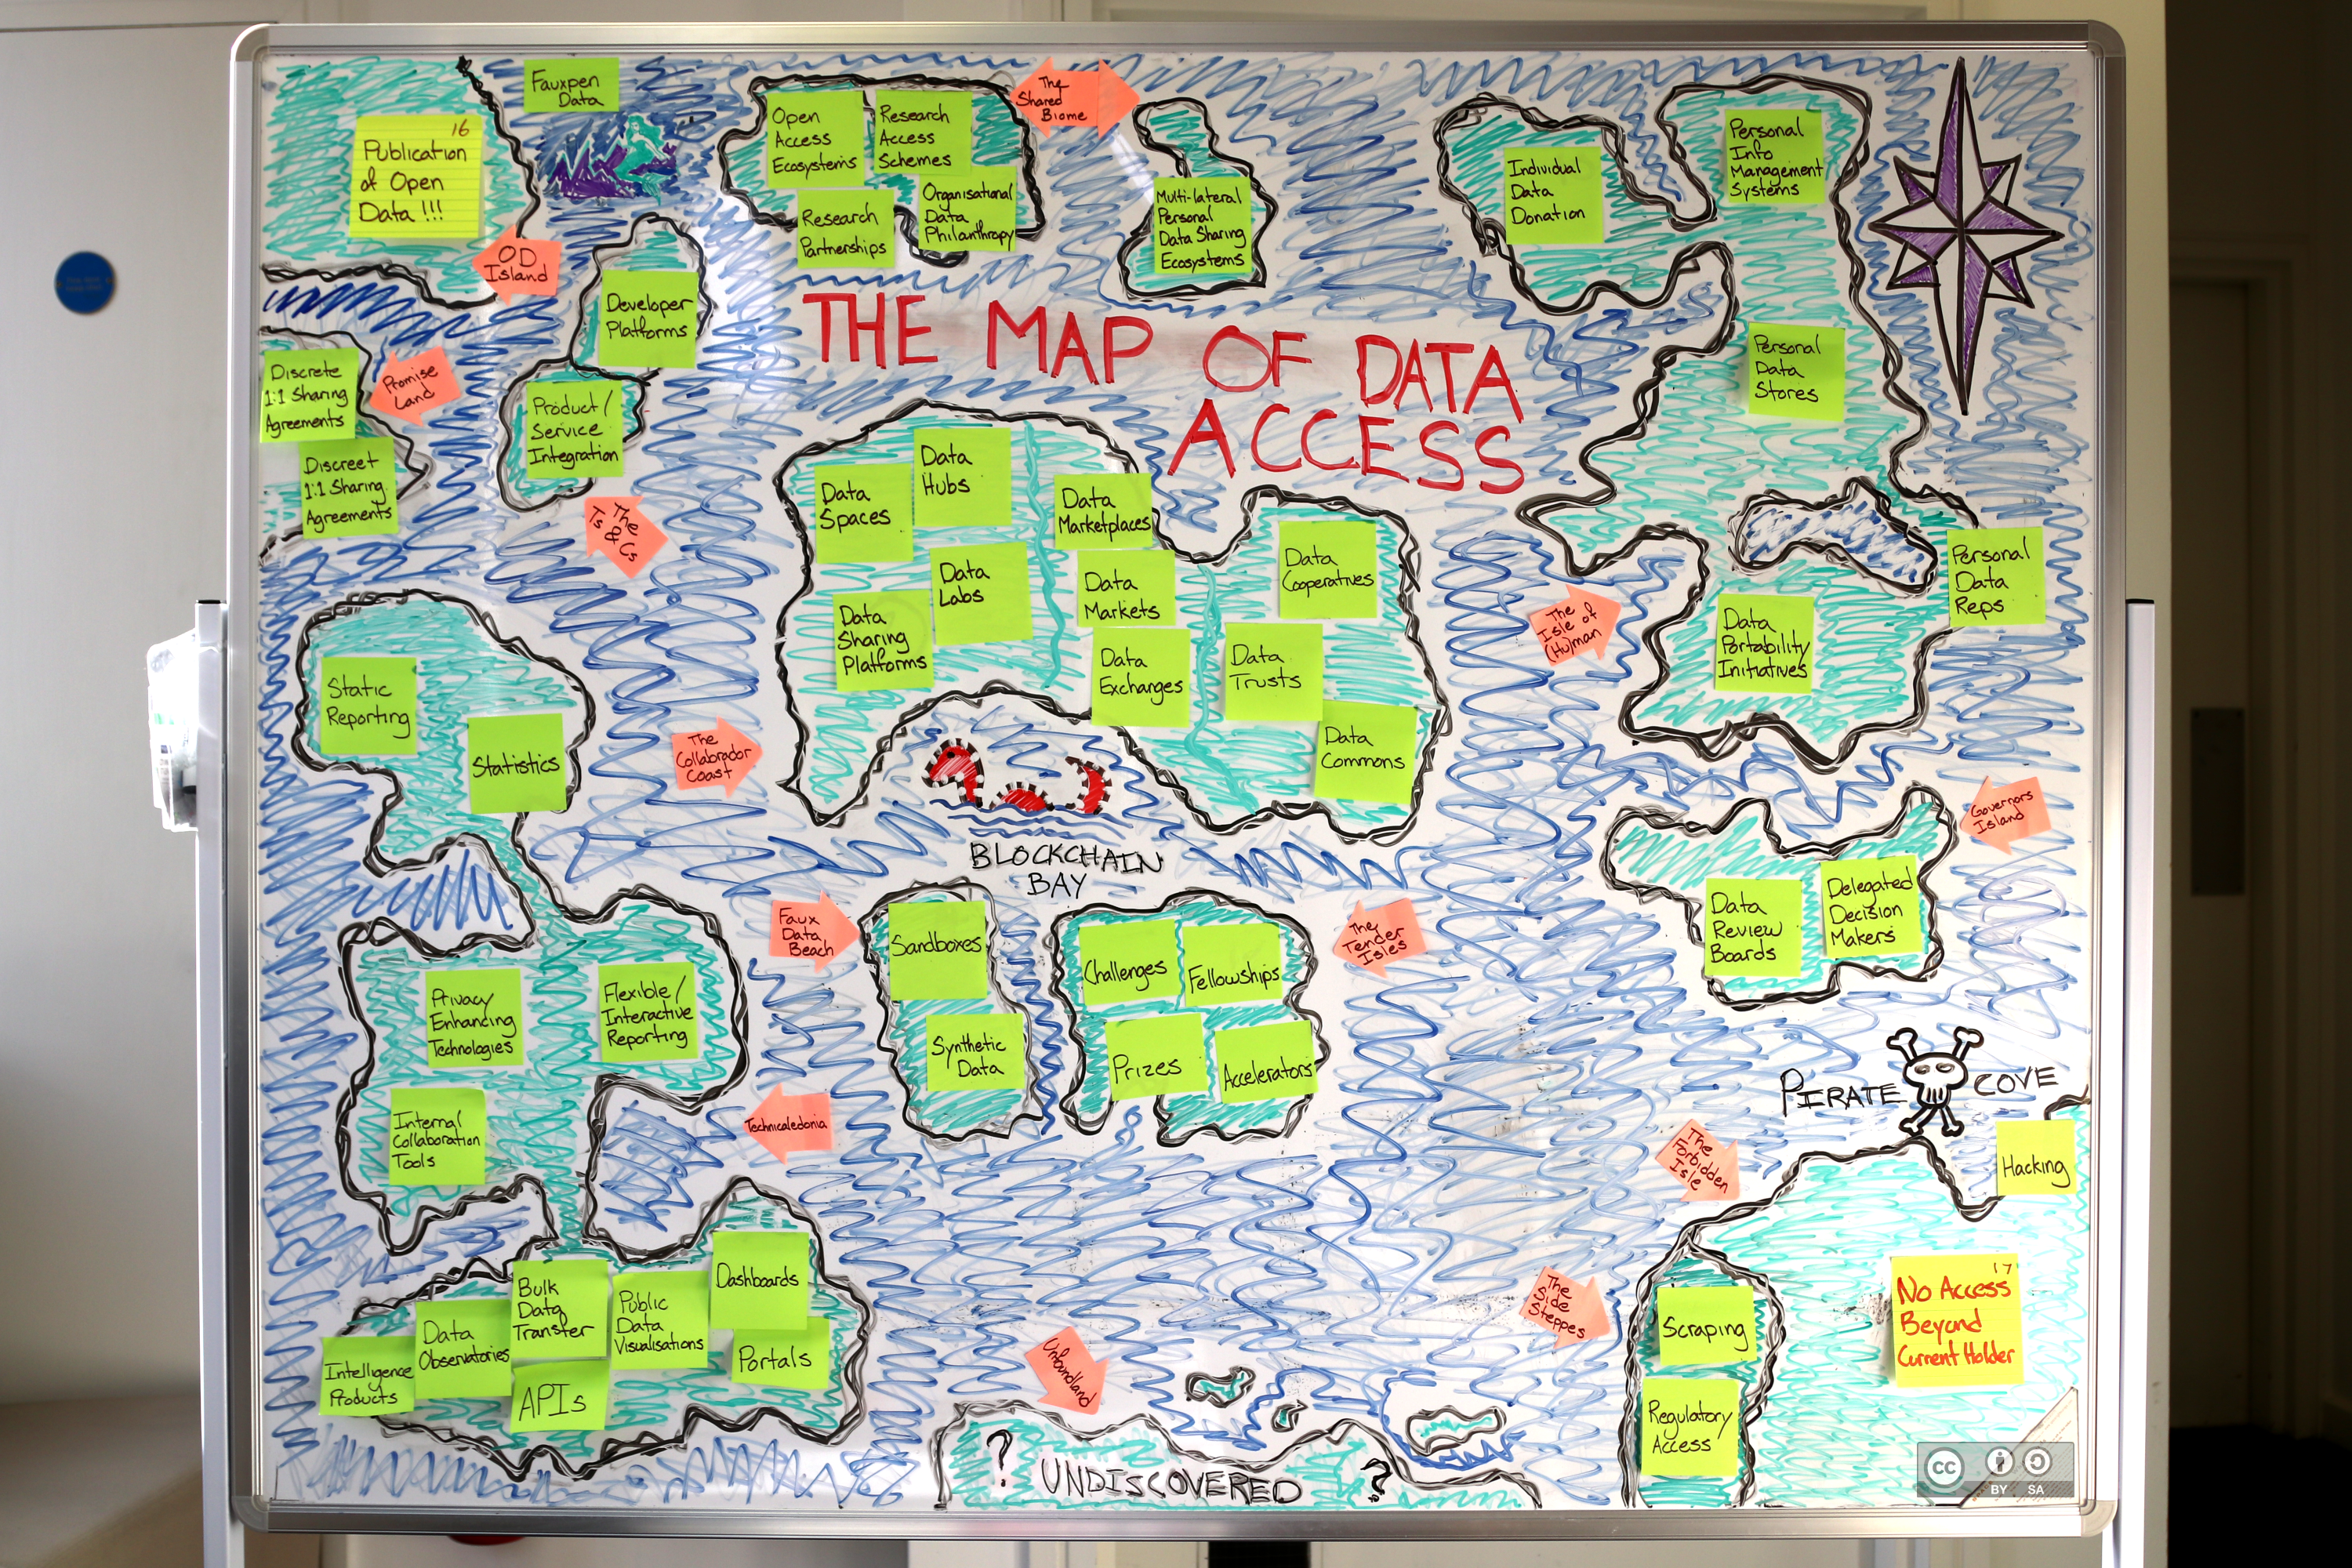
Last year, we drew a map of different models for accessing data on a whiteboard, to help us and others make sense of them. After using it and getting feedback on it, we’ve updated it and commissioned a graphic illustration
There are many different approaches that people can take to make data accessible to others.
We’ve been exploring these approaches at the ODI. While some of that work has focused on particular approaches, such as data trusts and open data, we have the wider goal of helping organisations understand, compare and adopt the right ones for them.
We published the first version of the Data Access Map (known fondly to the team as 'the DAM map') in November 2018. The map helps to navigate the range of different data access approaches being used and spoken about, and the variety of terms being used to describe them. It’s not a taxonomy – it includes technical means of accessing data and terms for entire ecosystems – but some of the approaches on the map have been clustered into different ‘land masses’ and ‘islands’, based on shared characteristics or features.
We’ve been using the Data Access Map in our work in the past six months or so, to see if it helps to communicate concepts related to data access. The map’s been used in our reports, to contextualise what we’re talking about in them, and has featured in presentations by members of the team at conferences and other events.
It’s had a really positive response: people seem to enjoy the way it looks and find it useful in exploring different approaches to making data accessible. It also continues to be wheeled into meetings in its original whiteboard form to facilitate conversations, meetings and workshops.
Equally, we’ve tried to observe how others have interacted with the map, and understand whether it would be a useful tool in their own work. To add to the informal comments and thoughts we have had, we asked people and organisations outside the ODI to give their feedback. We’ve had suggestions on the map’s format and design, and people also helpfully pointed out some data access approaches that we missed the first time around.
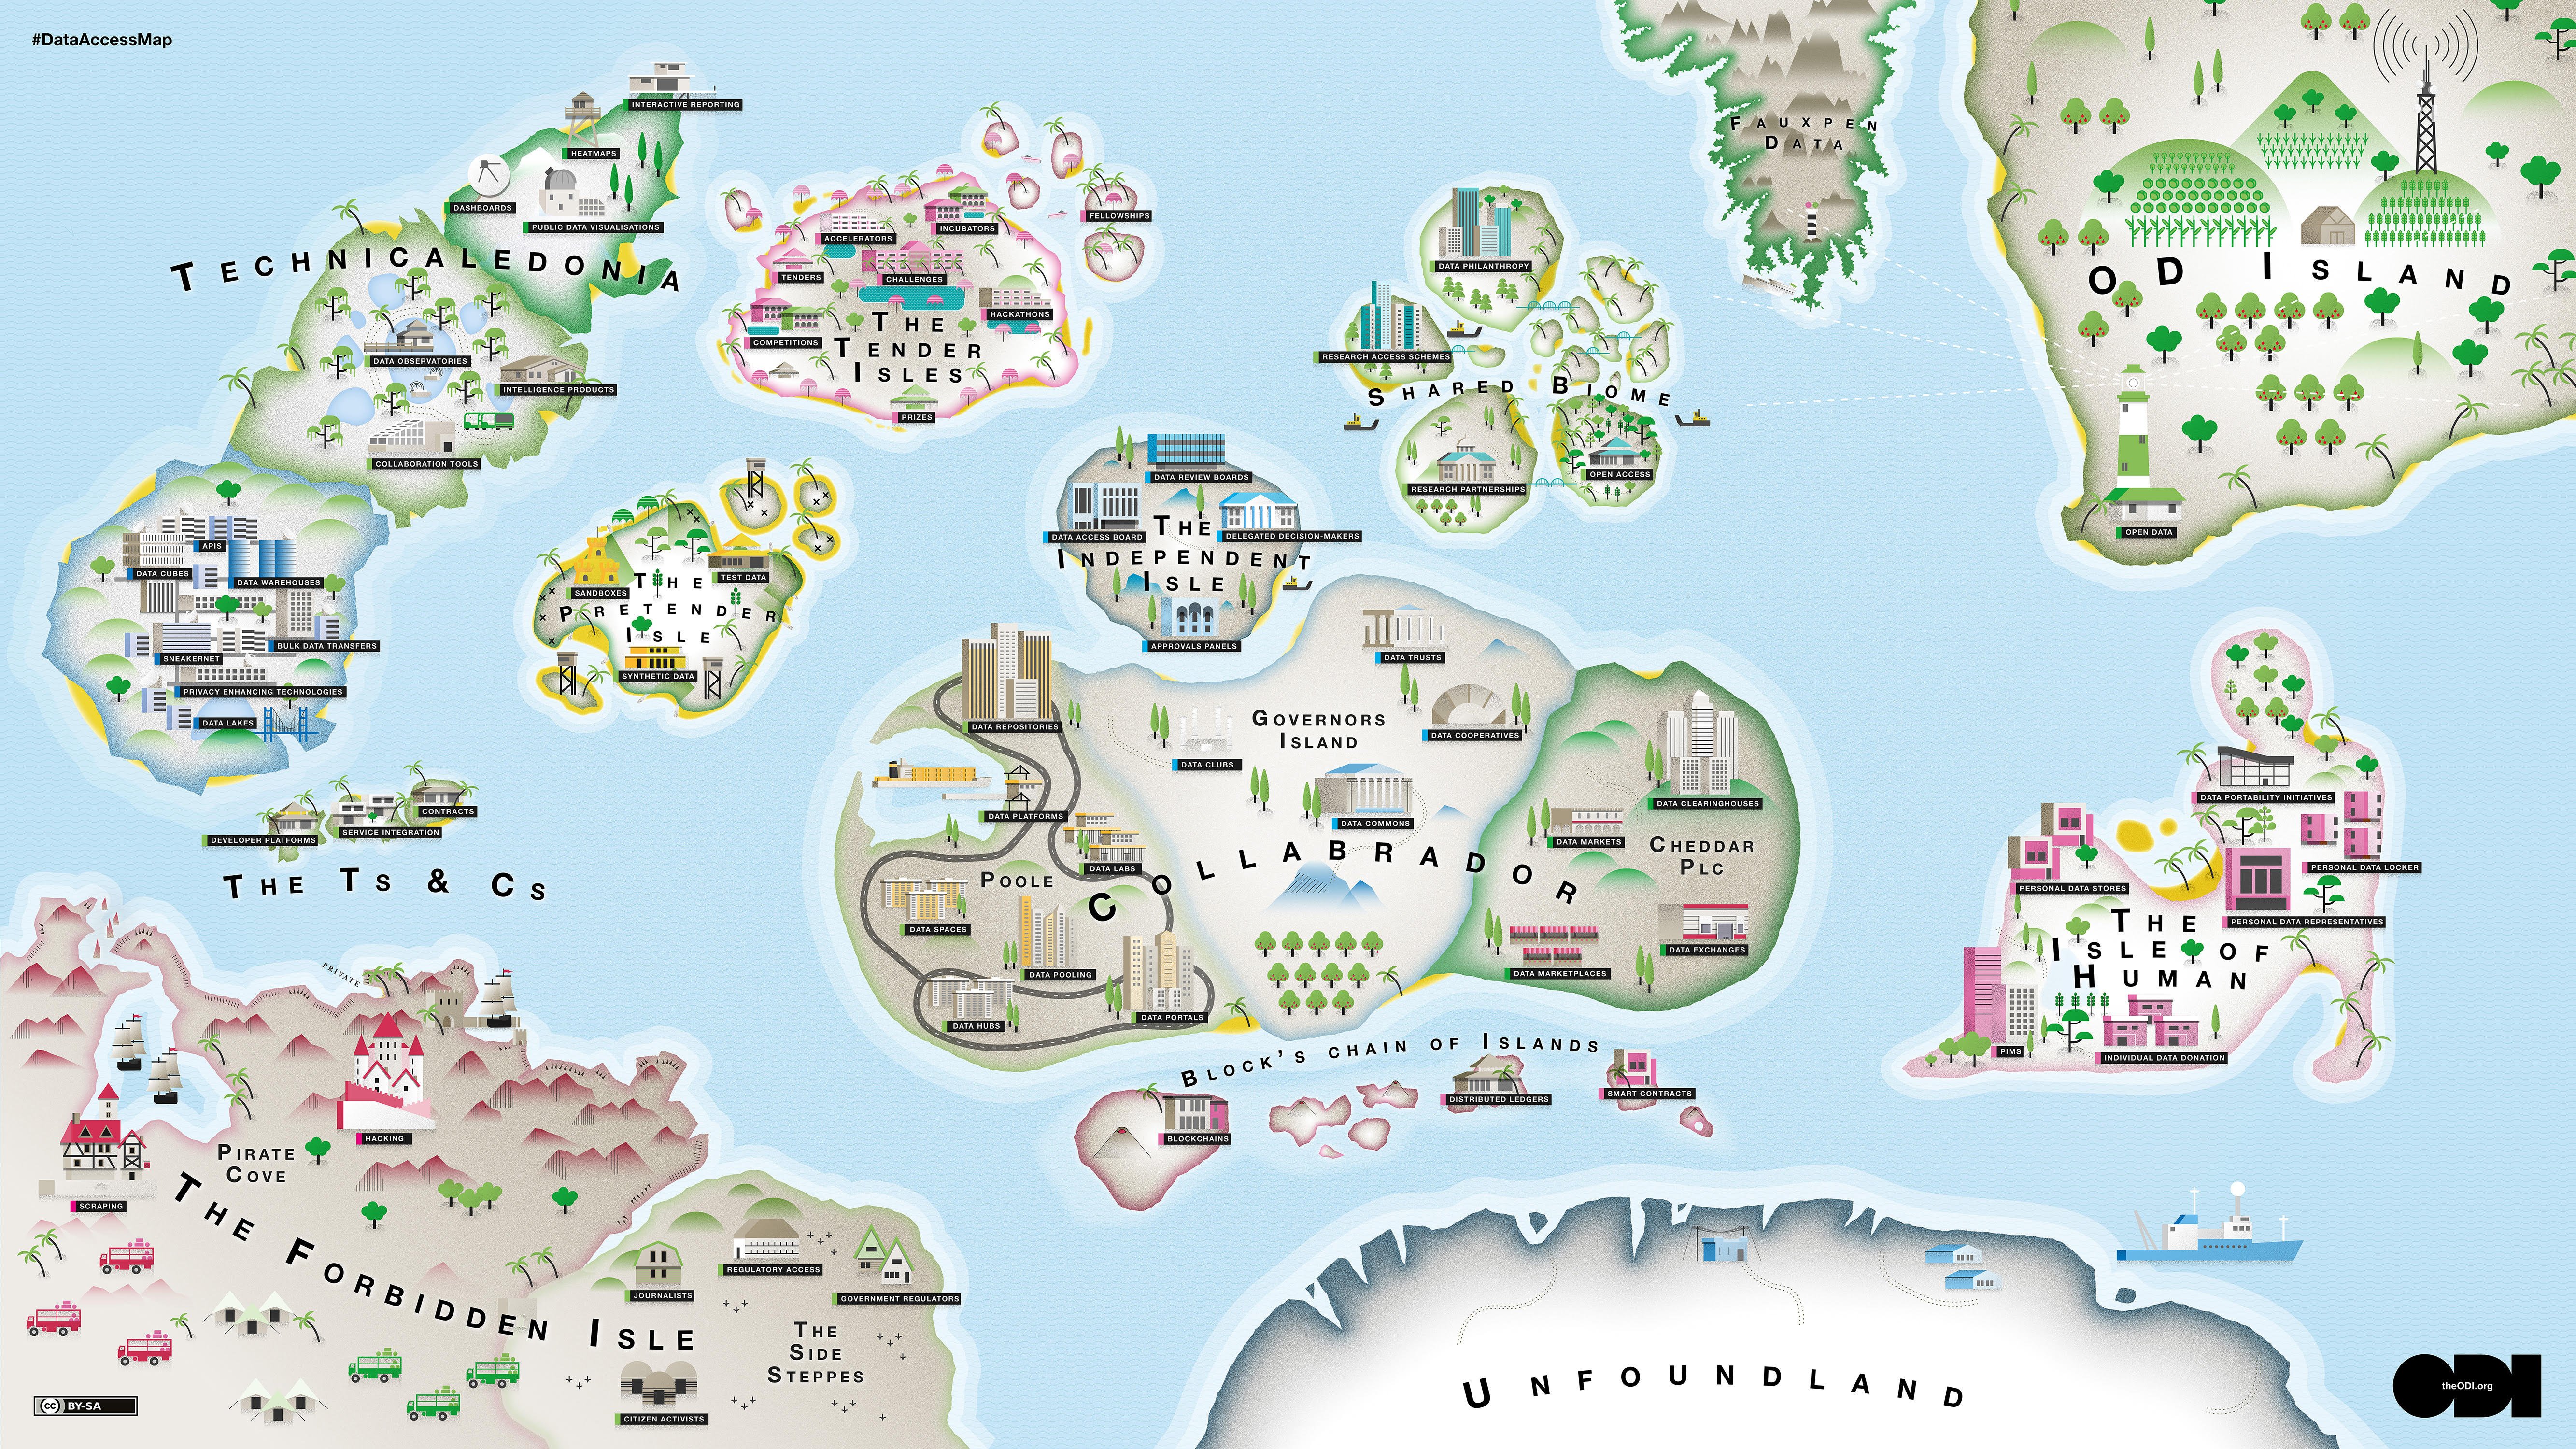
Based on our experience putting the Data Access Map to use, and the feedback we’ve had from others, we commissioned a graphic illustrator, Ian Dutnall of Icographic, to recreate the map.
The illustration challenge was quite different to any we had commissioned before, and one that Ian enjoyed taking on.
"The ODI always come up with the most imaginative briefs," Ian says. "For the Data Access Map each island or land mass had to have a unique character. Some were less explored, others were more developed. One of the most enjoyable tasks was to come up with an abstract shape that looked like a human, without being too obvious. The size of the map was a challenge – each area had to be scalable but also work together as a part of the whole.
"The details were loads of fun. It was particularly enjoyable designing pirate coves, mountain observatories, tropical research stations, ancient temples and beach resorts and assigning them to different groups or viewpoints."
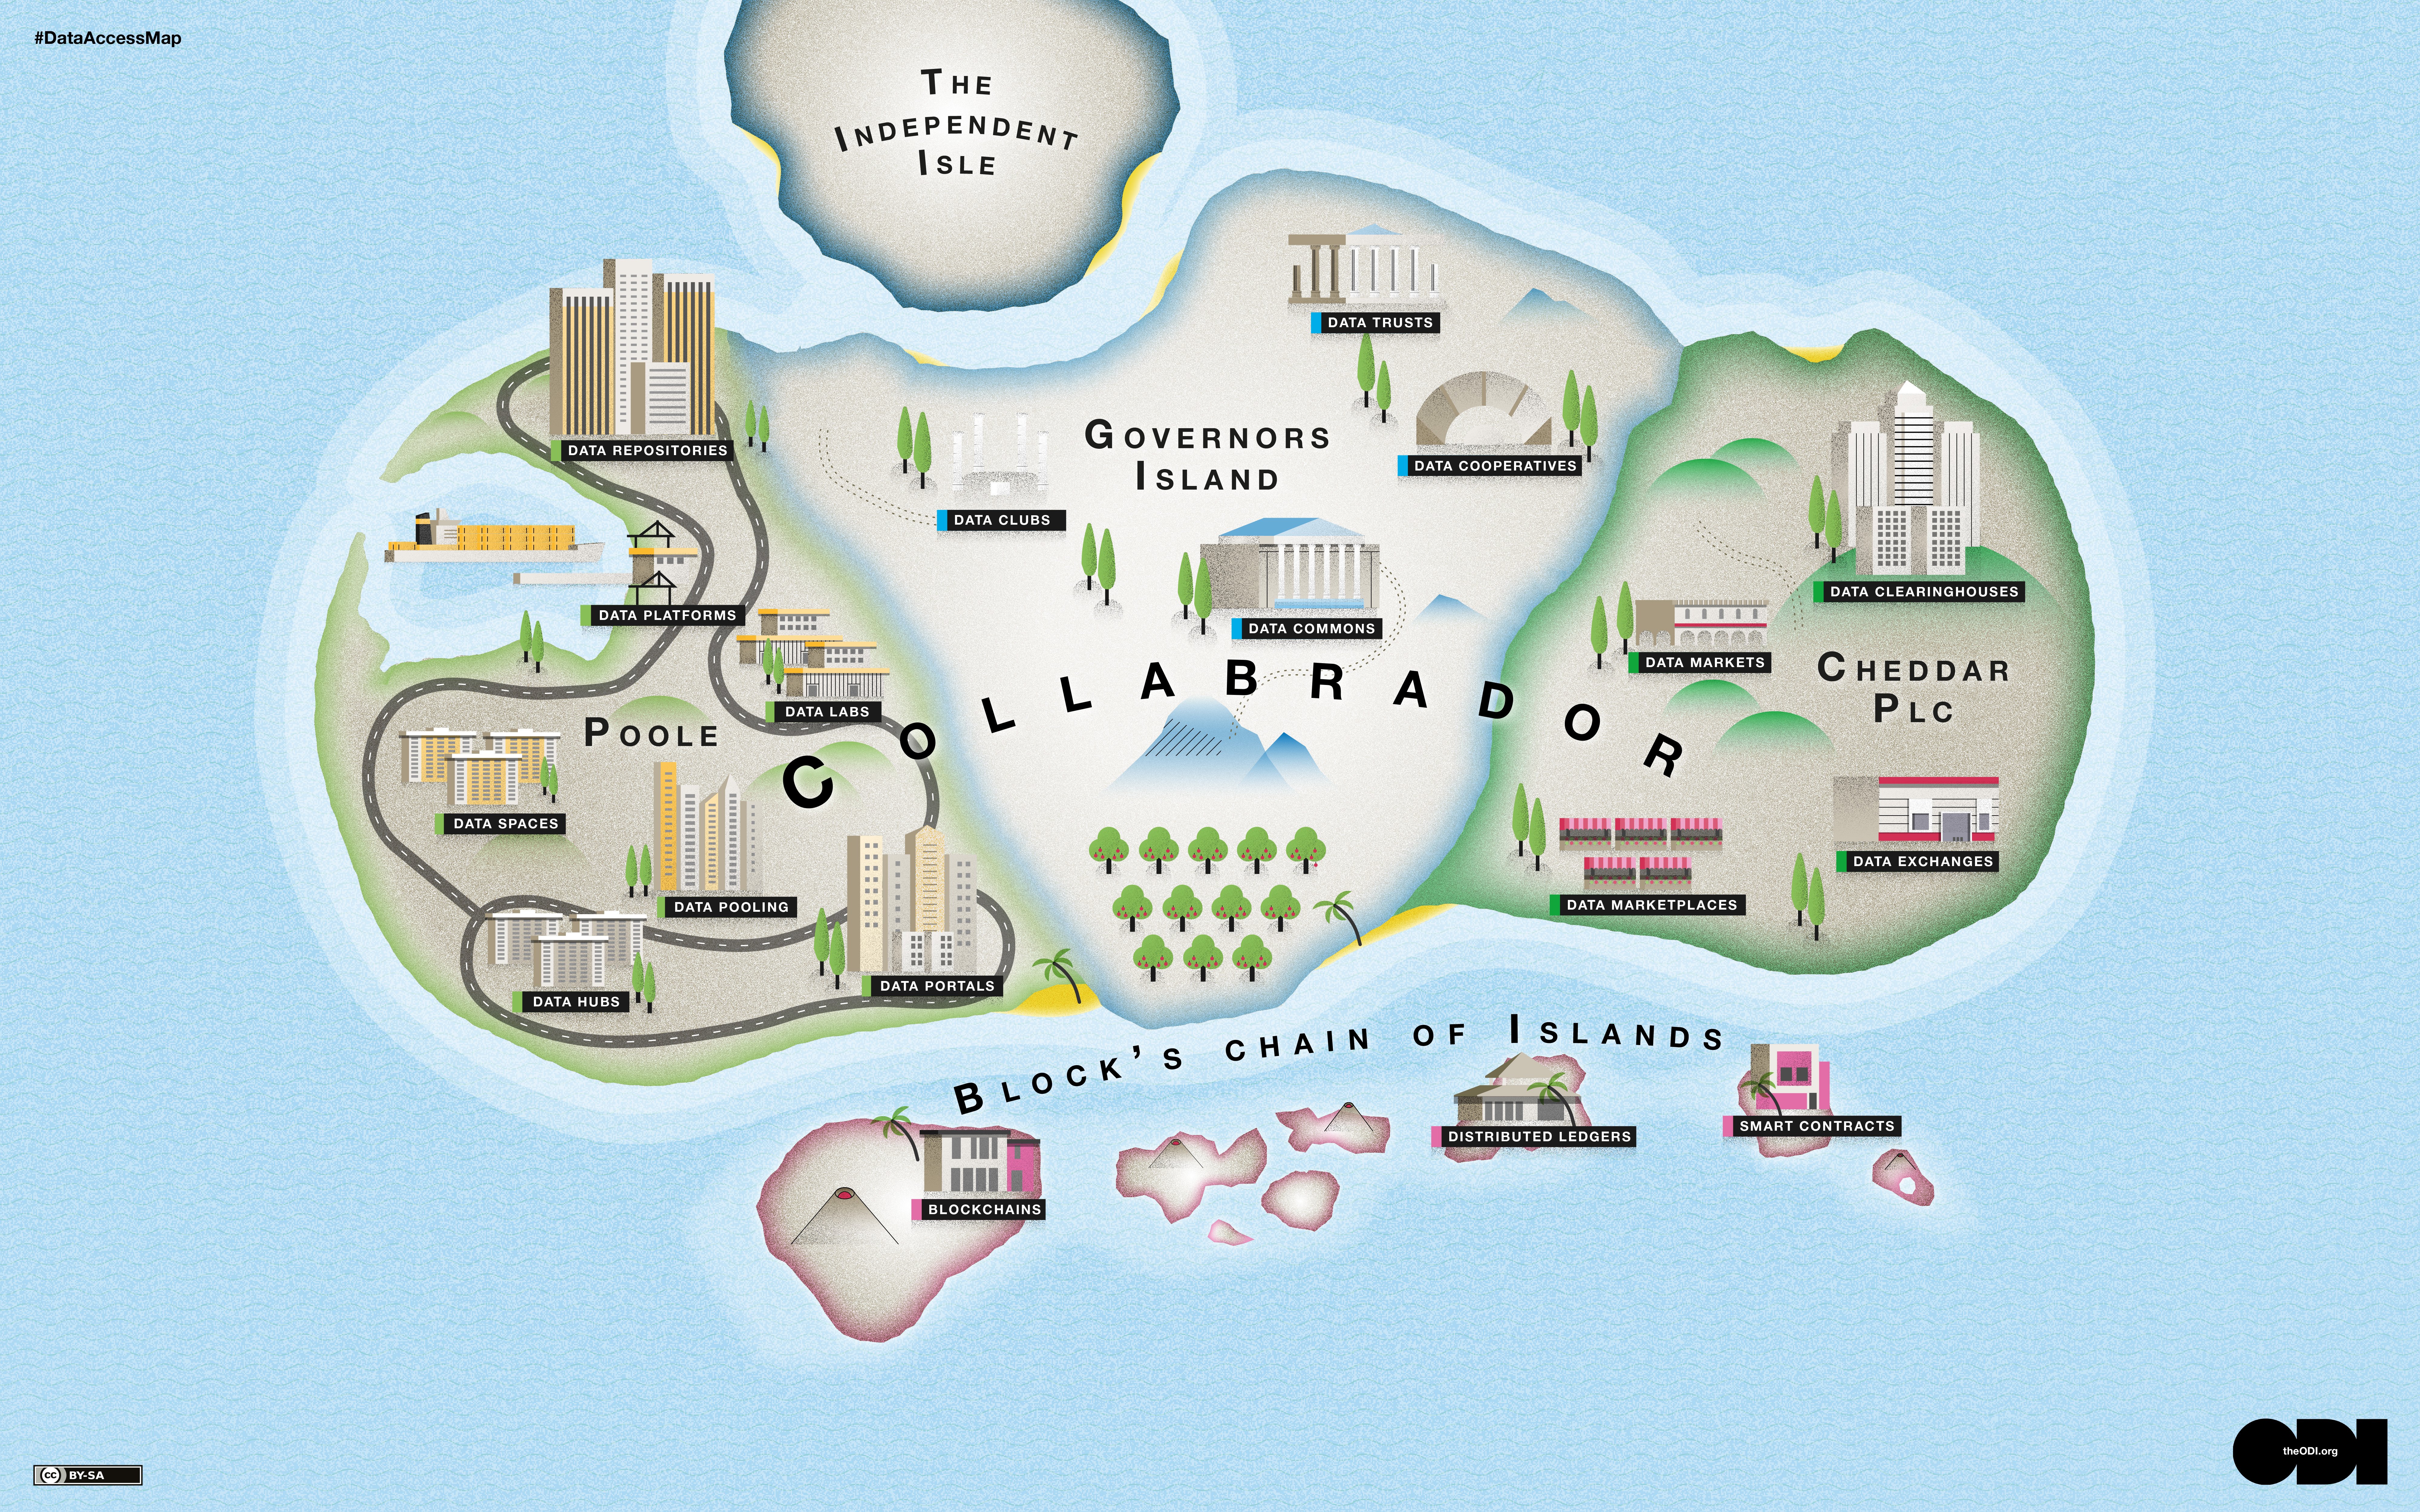
You can find high-resolution images of the map and land masses on this page.
What has changed?
The biggest change is the move away from the map’s original scribbled design. Although it had a charm, we think the map is more likely to be picked up and used by organisations in a more advanced state.
We have changed or added several things in the new, graphic version:
- We’ve added some new data access approaches.
- We’ve given the different land masses names that characterise the approaches found on them, to help people navigate their way around the map. For example, ‘The Isle of Human’ includes approaches where individuals have agency over data – such as data portability initiatives and personal data stores – whereas ‘Technecaledonia’ features data observatories, APIs and other more technical forms of data access.
- We've created close-up versions of each land mass to help us communicate different stories, problems and opportunities.
- The land masses have been moved to align the map with the ODI’s Data Spectrum, so ‘closed, shared and open’ approaches can now be read from left to right.
The Data Access Map will remain imprecise, unfinished and with much yet to be discovered, just like most used for navigating new terrain.
What do we plan to do with the new map
We plan to develop a travel guide that gives descriptions of the different approaches and examples of them that exist. We also plan to continue testing the Data Access Map with external people and organisations to understand their needs and how the map can meet them.
You can find high-resolution images of the map and land masses on this page.
If you'd like to get in touch with Ian about an illustration project, contact Ian Dutnall at [email protected]. You can see more of Ian's work at dutnall.com. We want to continue our journey with the map in collaboration with others. If you are a data holder looking for guidance on the various data access options available to you, if you have thoughts on how to improve the map, or if you’d like to get involved in our work, get in touch with [email protected].