
Data institutions are organisations that steward data on behalf of others, often towards public, educational or charitable aims. At the ODI, we think of stewarding data as collecting, maintaining and sharing it – the foundational activity that shapes what types of products, services and insights it can be used to create, and ultimately, what decisions it can inform.
We’ve been exploring and documenting different aspects of data institutions, such as how they make decisions about who has access to the data they hold, and their quest to operate in trustworthy ways. In parallel, we’re exploring how these functions are supported by technology.
Different technologies are used by data institutions to manage datasets – eg to store, secure, share and interact with data – and support the functioning of the organisation. For example, technology can be used for analysis, facilitate decision-making, or enable collaboration.
We’d like to help people setting up and running data institutions to understand the tools, systems and other technical infrastructure they need. But we’re finding there is no simple answer or checklist; technology systems are as unique as organisations are. Even though some of us at the ODI have technical backgrounds, we haven’t experienced every size and shape of system. So we decided we’d document and learn from people who are working with real systems every day.
We interviewed technical specialists from six data institutions who participated in our recent stimulus fund and peer learning network, asking them to describe the technologies they use to steward the data they hold. As we learn more from existing data stewards we hope to uncover common patterns so we can share what works under what circumstances. While we build up a catalogue of case studies, we thought it would be interesting to showcase the diversity of technical configurations, which reflects the diversity of the organisations’ missions, and shows clearly that there is no one-size-fits-all solution.
Communicating the technologies used to steward data
We’ve also been thinking about how to communicate this diversity. Technical specialists will often draw boxes to represent whole systems with arrows between them to represent data flow; for some a box might represent a crucial library or language, whereas a single system might be represented as stacked layers. However, differences in scale and detail make it difficult to compare and contrast diagrams. We needed a shared language and framework which we can use to document and discuss with technologists and non-techies alike.
We’ve been experimenting with a visual tool to both guide conversations and document technologies used by data stewards by relating them to their purpose – inspired by some early frameworks guiding research into legal, governance, technical and commercial strands of data stewardship. The round shape will help integrate the technical interactions into an ecosystem mapping exercise.
We’ve created a prototype version of the worksheet, hoping it helps other technical specialists to document and think about the technologies they use, or for non-technical colleagues to help guide their discussions with technical specialists. We’d like to use it ourselves in collaborative tools like Jamboard or Miro during planning exercises. Please get in touch if you would like a copy of the prototype to use in your own organisations.
Comparing the technologies of data stewards
Below we’ve plotted the key technologies raised in the interviews. Displaying them this way highlights concentrations and distribution of technologies at different layers, almost like a heatmap. It’s also helpful to scan for technologies at a glance, in context of their purpose.
This visual comparison surfaces a few insights about the relationship between stewardship roles and technology, although, we must be careful to read too much into a small sample:
- Note how organisations that play similar roles in a data ecosystem use different technologies for the same purpose. This can be for a number of reasons: for example, the people making technical decisions have varying technical backgrounds and experience; datasets vary in format, scale, distribution and quality; and different technologies can solve the same problem.
- Compare and contrast DNV and MyEd, who combine data from different sources, with Etic Lab who provide infrastructure to transfer data with minimal data storage. Note the variety of ingress and egress technologies for the former organisations who are at the centre of a data ecosystem.
- Compare and contrast Buenos Aires Statistics Bureau and The Data Place who are creating open datasets, with Etic Lab, DNV and Dsposal who restrict access to some data. Note that complexity and specialist technologies are introduced into the gatekeeping layer further along the data spectrum towards closed.
- MyEd, Dsposal, DNV and The Data Place have ongoing communicative relationships with their users which may account for more ‘operational tech’. Note that all these organisations play the role of combining and linking datasets.
- Governance seems to be low tech, although we might need to dig deeper here.
- Technology can be used to minimize the storage of data. Eg in DNV’s case with its Kuva project, services may pass through, or operate on data without the need to store it – creating monetizable services without needing to store data. In this case the organization is a steward of the technical infrastructure that enables flows of data.
Using technology in practice
High-level technical case studies for each organisation describe how those technologies are used in practice below. However, one hour’s interview is only long enough to cover the most significant components and a different technical specialist might have painted a different picture.
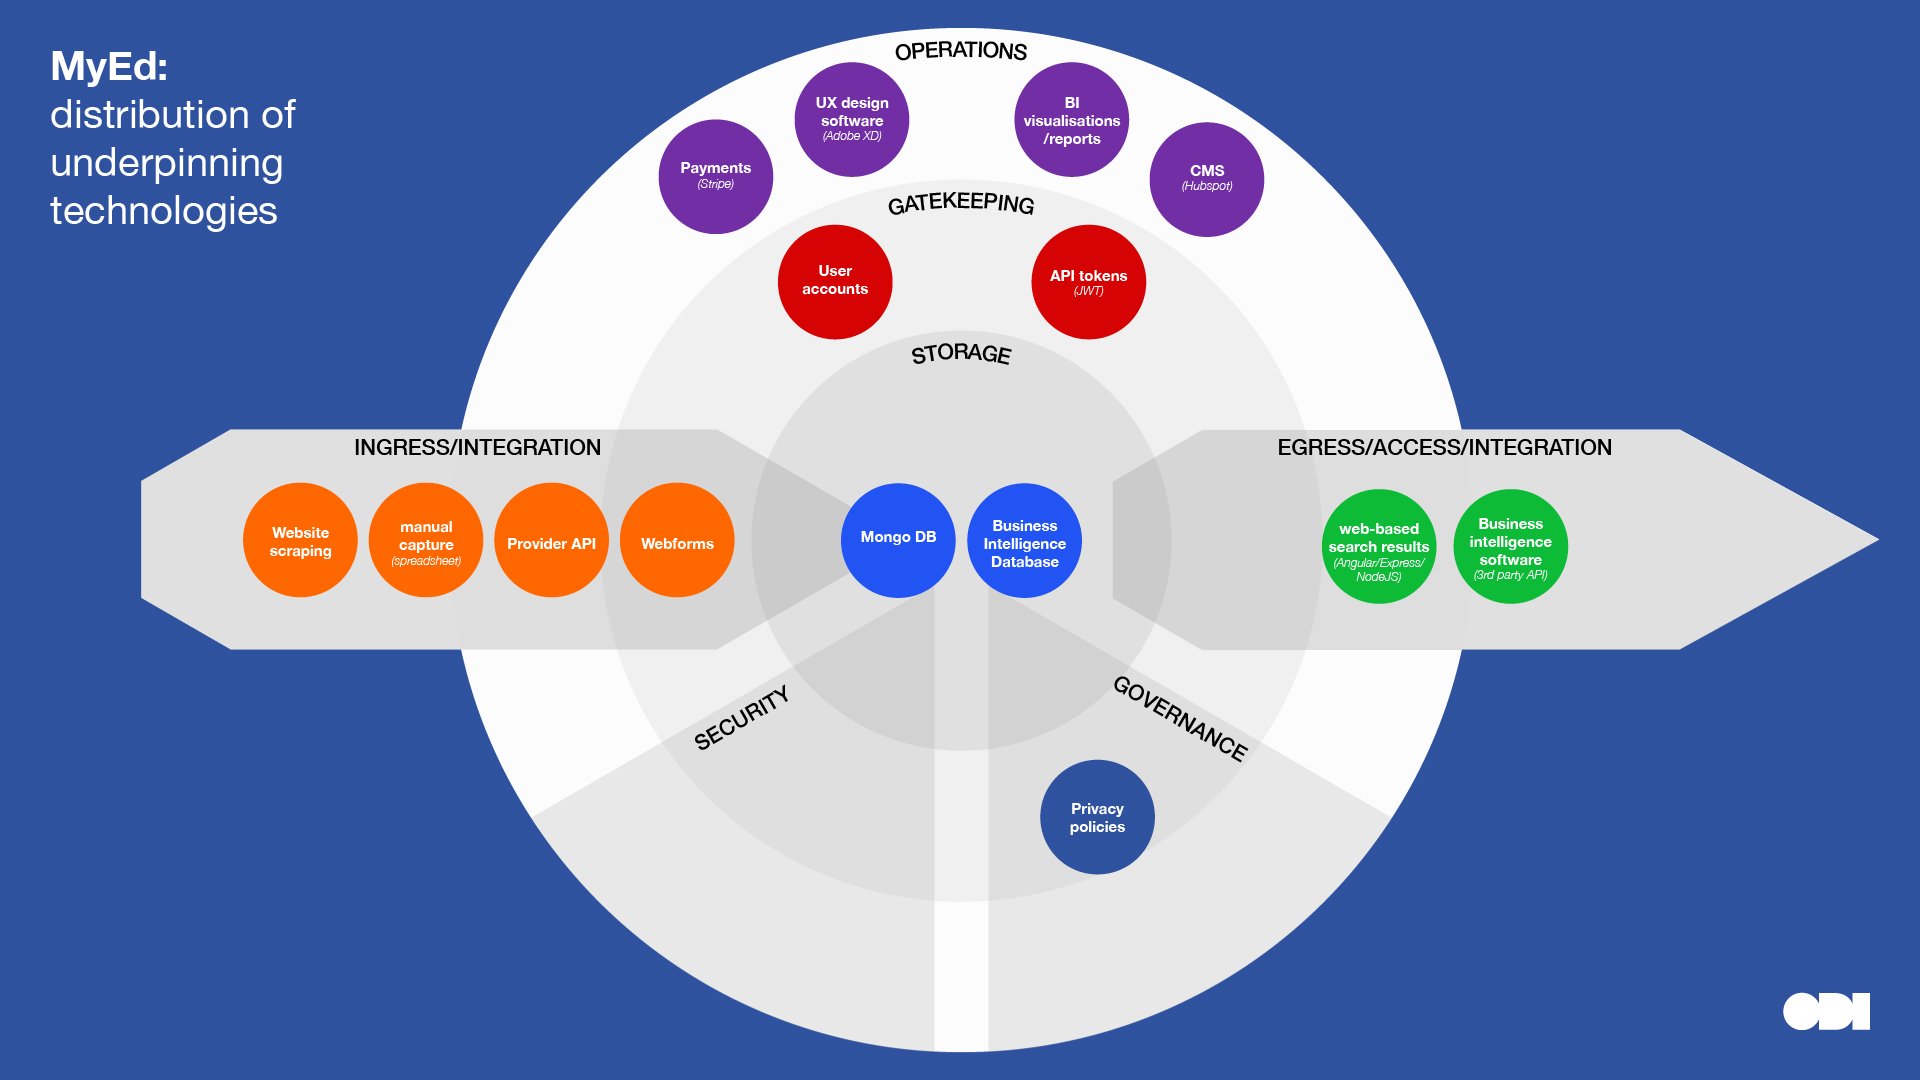
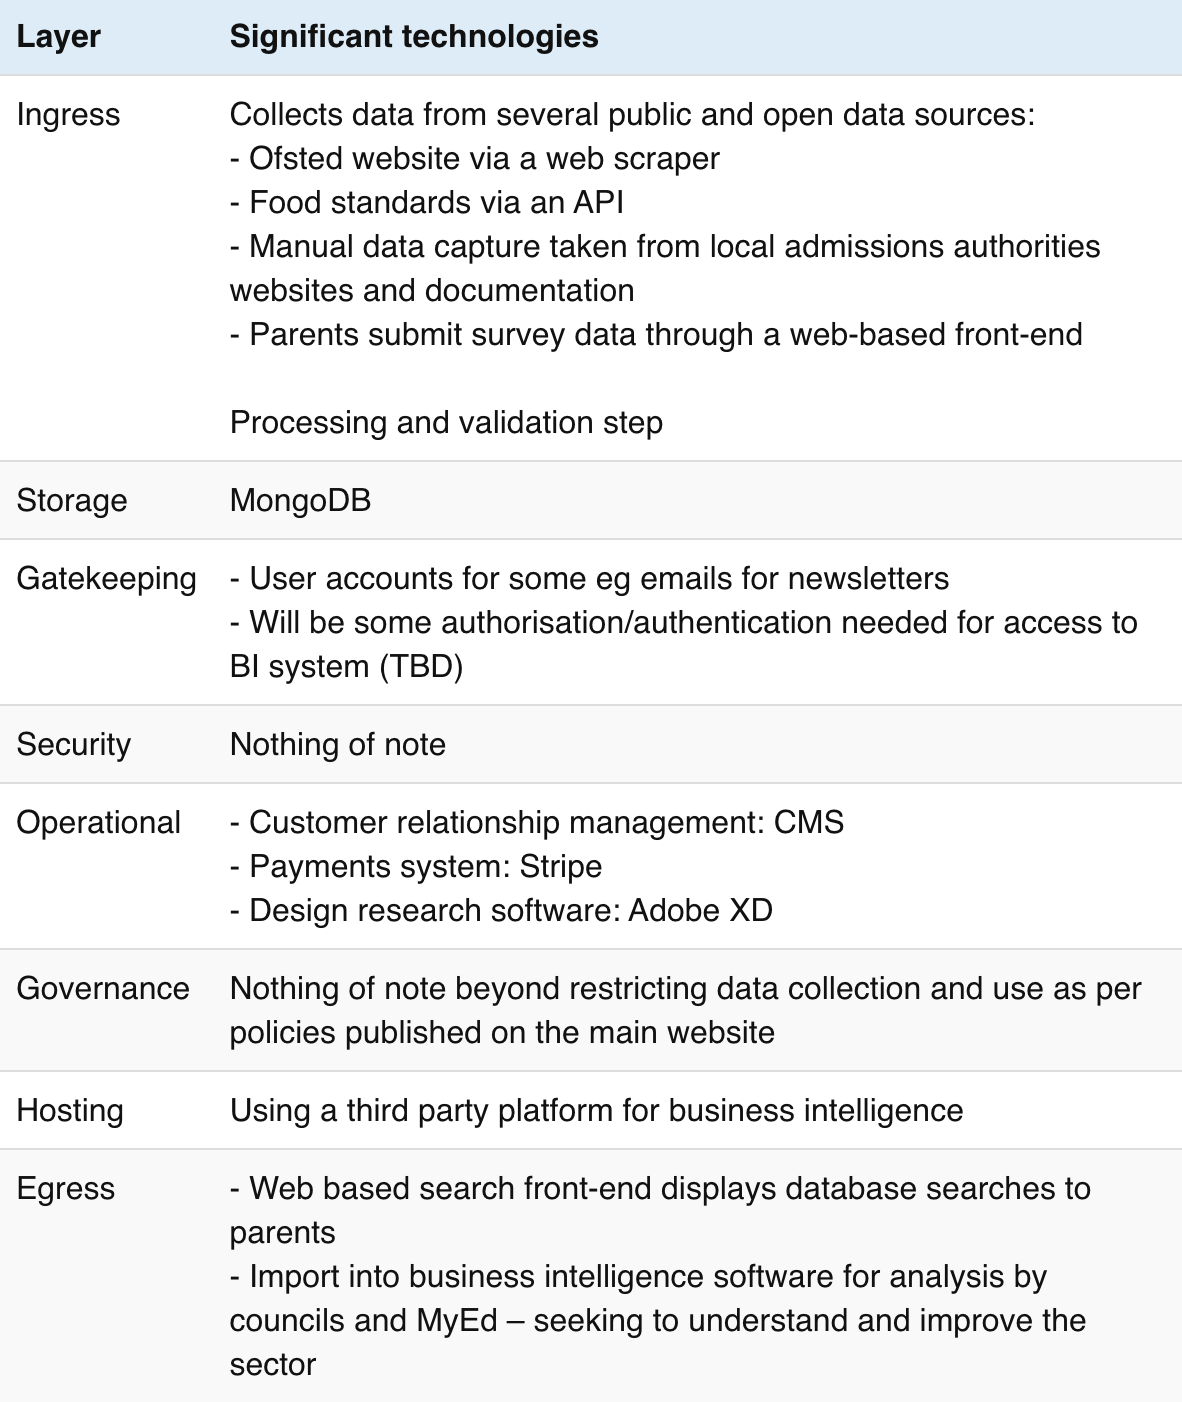
MyEd
Stewardship role: Combining or linking data from multiple sources Category in Data Institutions Register: Data hub Dataset archetype: Database
MyEd’s primary aim is to inform parents about school choices. It combines and links open sources of data such as OFSTED ratings, geolocation, food standards, air quality, as well as crowdsourced survey data from parents. The combined data is presented on a website and transferred into analysis tools for study by parents, schools and MyEd itself. These analysis tools are used to correlate and visualise data to surface insights, to inform decisions and education policy, and encourage open innovation using the database.
Data is fetched from APIs where available. If not available, it is captured in various ways depending on whether the process can be automated, sometimes requiring a manual process to transfer non machine-readable information into spreadsheets before being imported into the central database.
In the early days, while the company was converging on its business model, it used WordPress with an in-built MySQL database, but outgrew the technology when the number of queries caused concurrency errors. The business has now developed enough to be able to afford an enterprise level system, which has become necessary as the importance of the data has increased. MyEd partners with a technical agency which designs, develops and manages its growing technology stack.
The current technologies are optimised for search and analysis. Although the technology stack continues to evolve as the data grows. For example the technical team is investigating separate systems optimised for machine learning models.
Ultimately the technology is designed to support the user experience. Where the technology no longer supports the needs of the users, MyEd would choose a different technology.
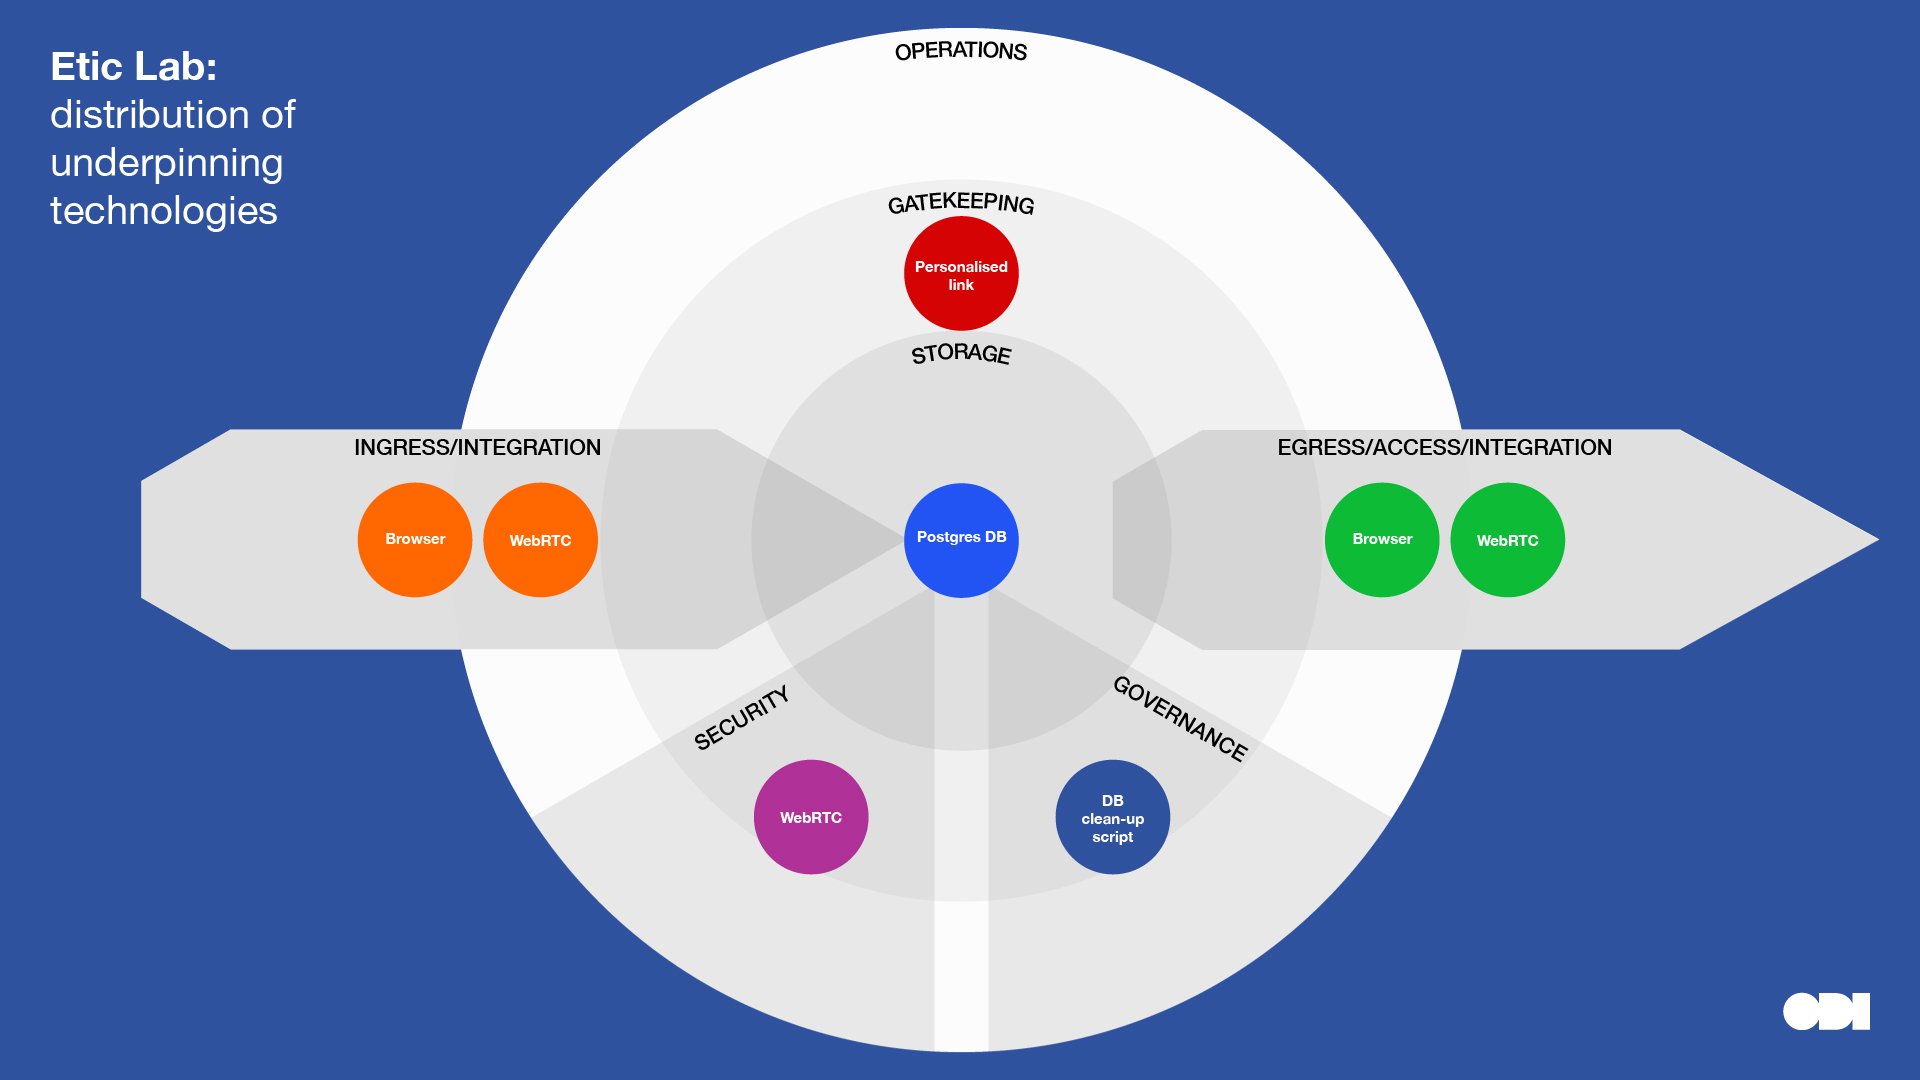
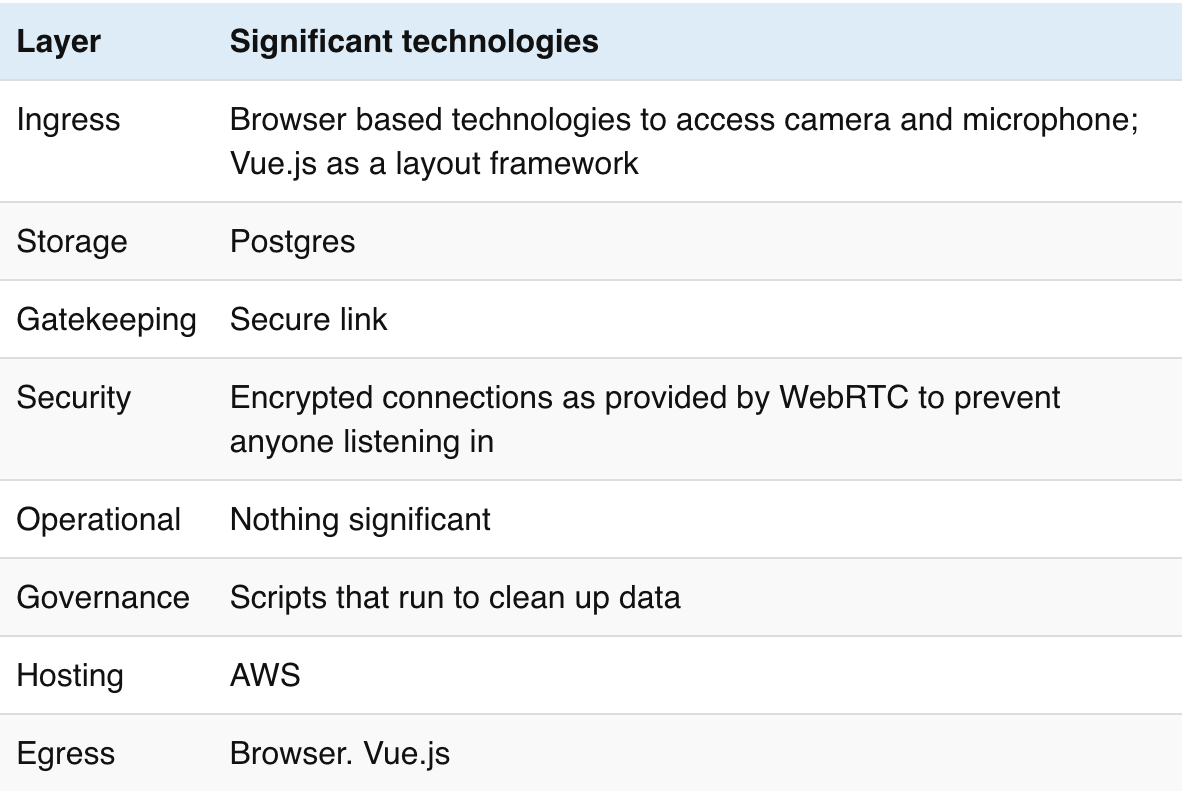
Etic Lab
Stewardship role: Acting as a gatekeeper for data held by other orgs Category in Data Institutions Register: n/a Dataset archetype: n/a
Etic Lab is a research and design consultancy who works on many projects that require dedicated technical systems. One project, Kuva, is a private video conference tool designed for communication between advisors working with vulnerable clients primarily in the justice sector. The company has carefully created technical infrastructure that enables end-to-end ‘privacy by design’ and chosen technologies accordingly to minimise any data storage so that clients have confidence to speak privately about sensitive matters.
The technical infrastructure is based on an open source third-party framework called WebRTC which securely connects browsers without storing data. Minimal data is encrypted and stored only to establish the connection and create a sharable link, it is deleted soon after the call is ended.
Etic Lab first built a proof-of-concept system hosted on DigitalOcean and has since transitioned to a hosting provider that can offer more fine-grained security. Having carefully evaluated AWS as the current hosting provider, the technology team continually re-evaluates this decision. It remains open to running the technology on its own servers in a secure data centre or working with another infrastructure platform if the situation were to change.
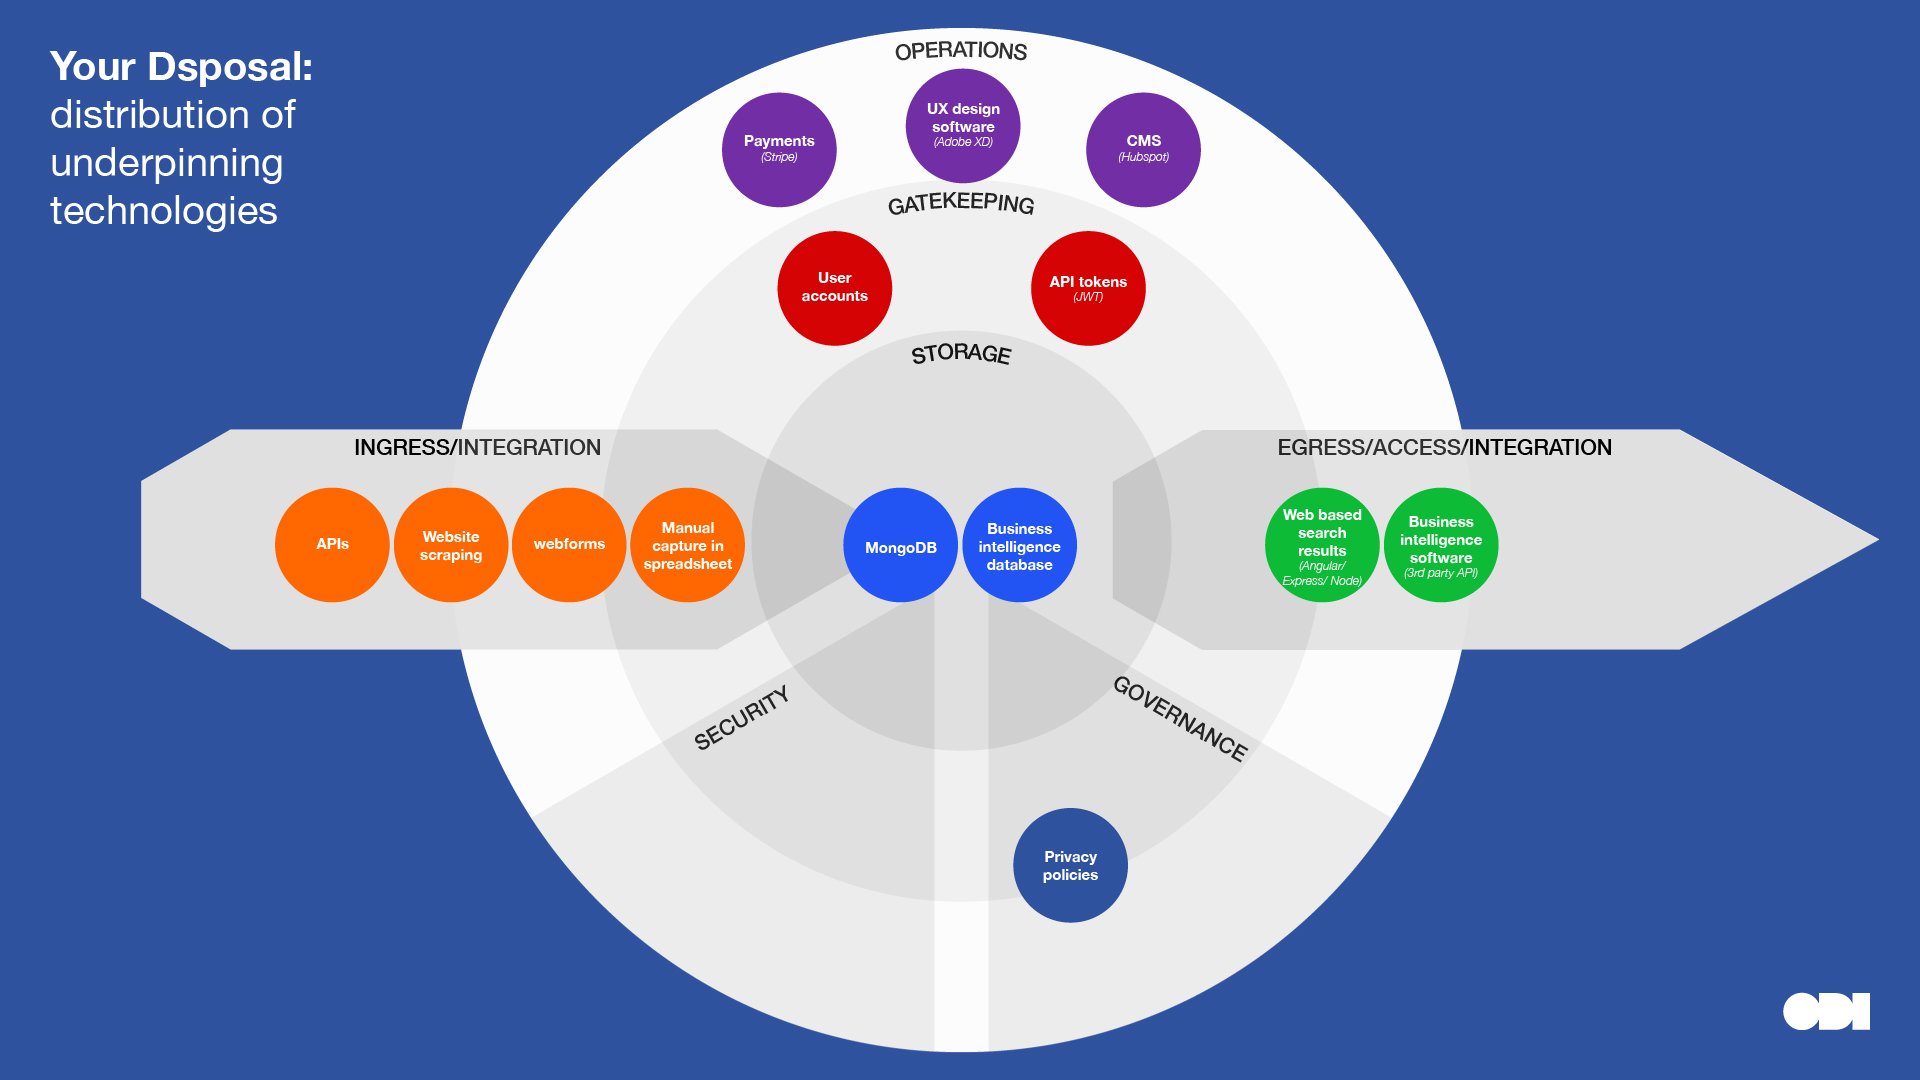
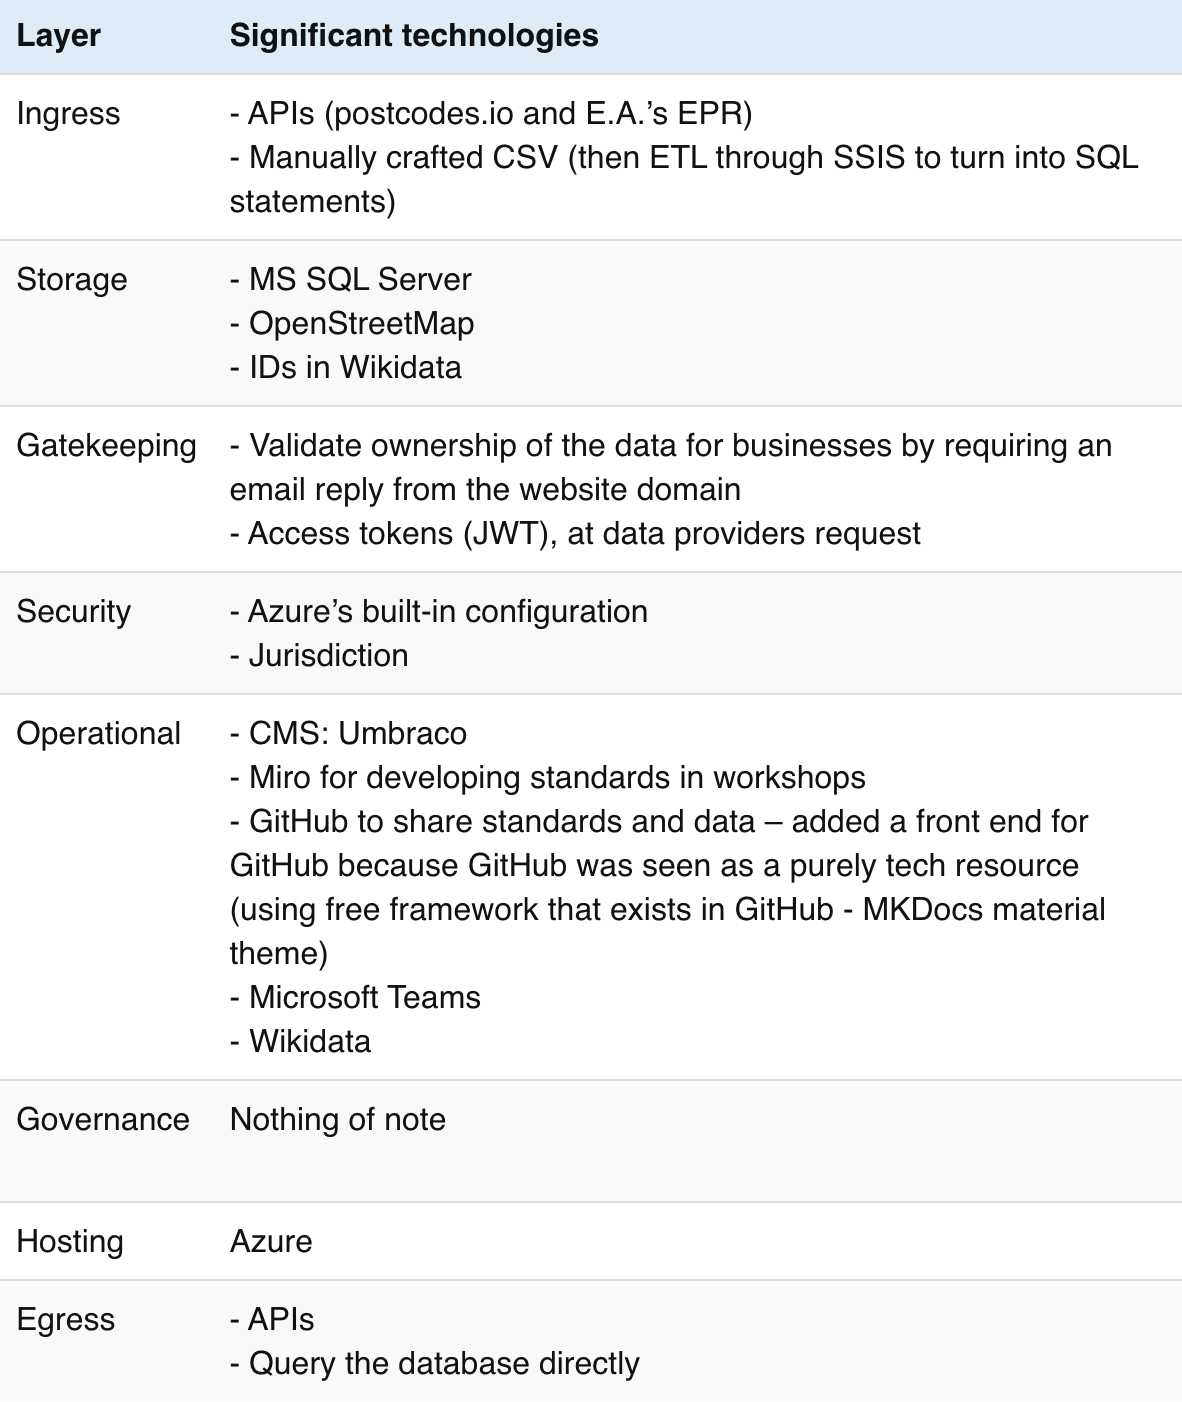
Dsposal
Stewardship role: Combining or linking data from multiple sources Category in Data Institutions Register: Data hub Dataset archetype: Database
Dsposal combines data from local authorities, councils, government agencies and recycling centres with the ultimate aim of helping people and businesses find the right place for their waste. Data standards developed by Dsposal make it easier to compare and combine data from different sources. Technology, data and standards enable Dsposal’s mission, but are also used to demonstrate what is possible. Here, technology is a driver for digital transformation: improvements to official information are passed back to the source, encouraging development of official APIs as the data improves.
Some data is stored centrally, but Dsposal also uses collaboratively maintained datasets such as OpenStreetMap and Wikidata to host and improve identifiers and metadata about recycling centres for more general public use. GitHub is used to share standards and data, with a separate user interface making it more accessible to non-technical collaborators.
The organisation’s founders have long experience in Microsoft products which has influenced their current technical choices; but their systems continue to evolve as the performance demands on the data architecture grows and the company gains more experience in data management. For example, replacing functionality currently handled by a bells and whistles CMS system developed with something more suited to Dsposal’s current needs.
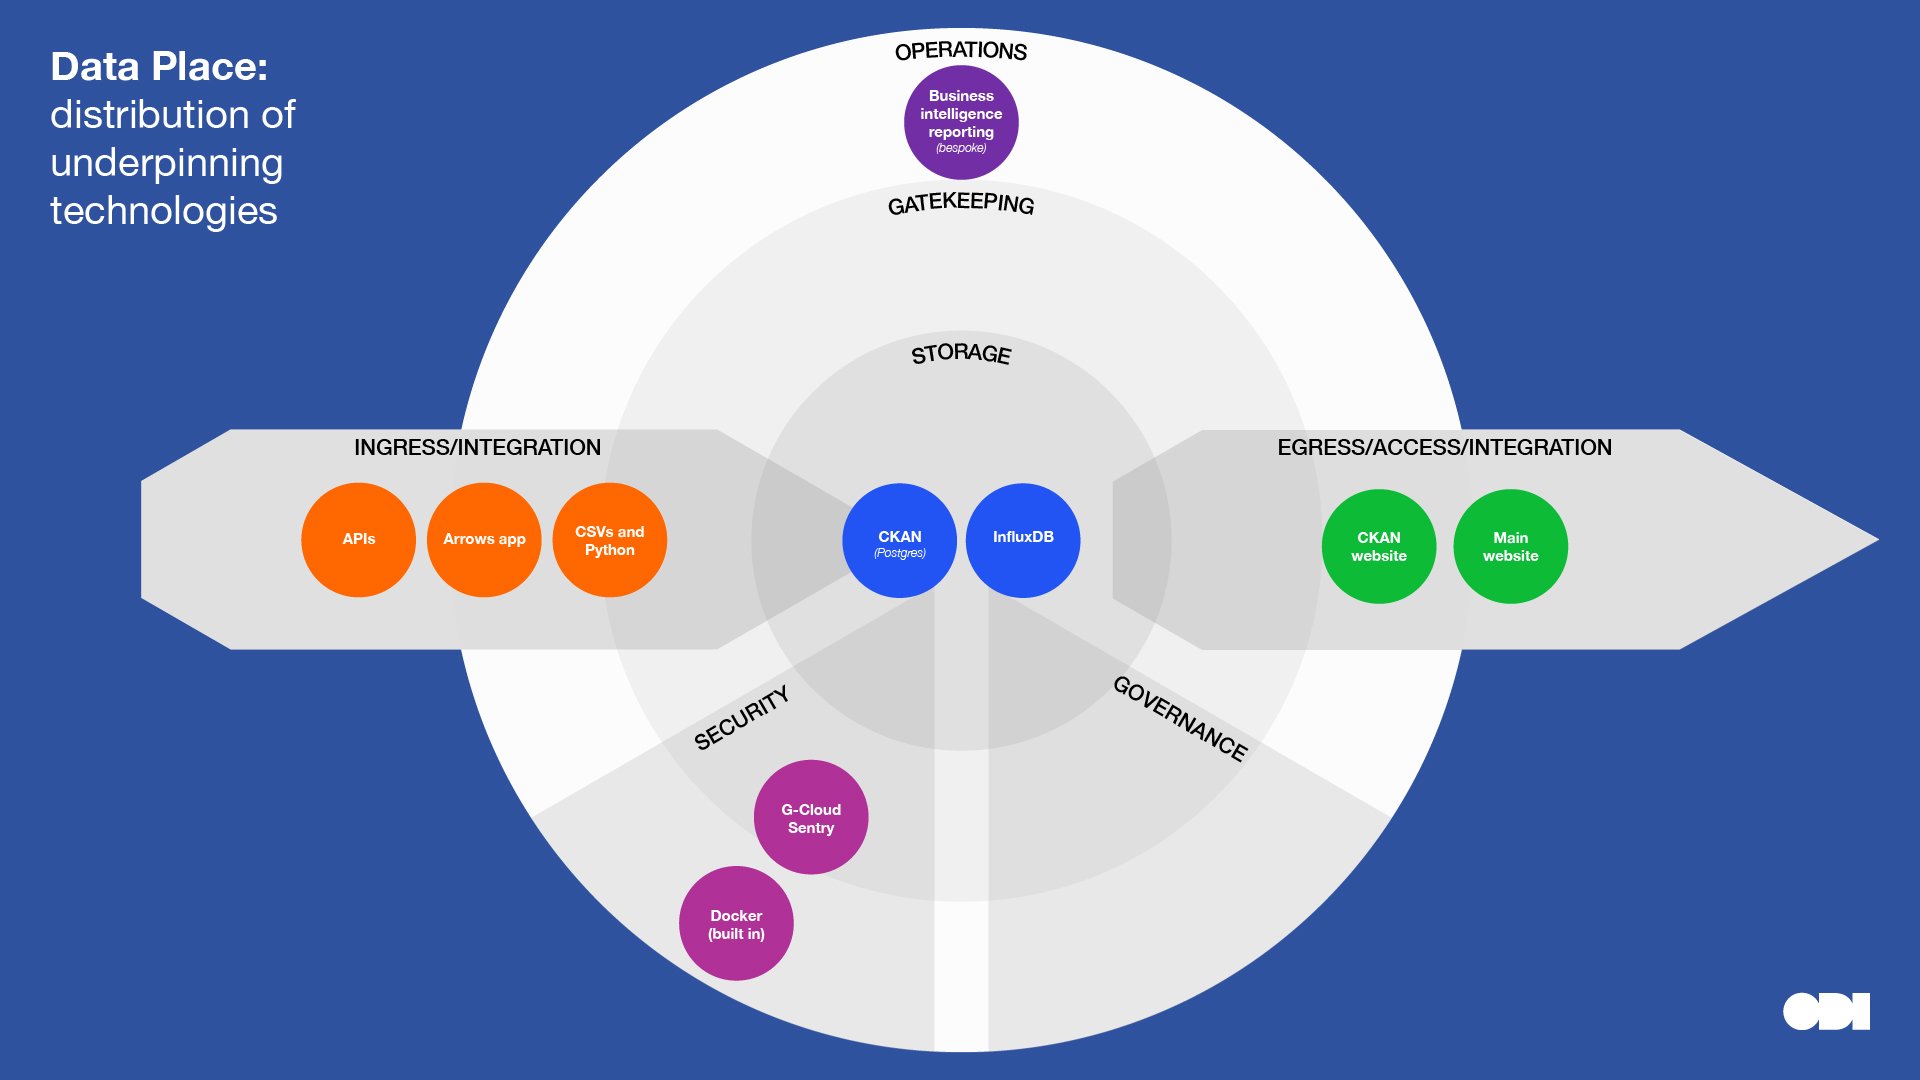
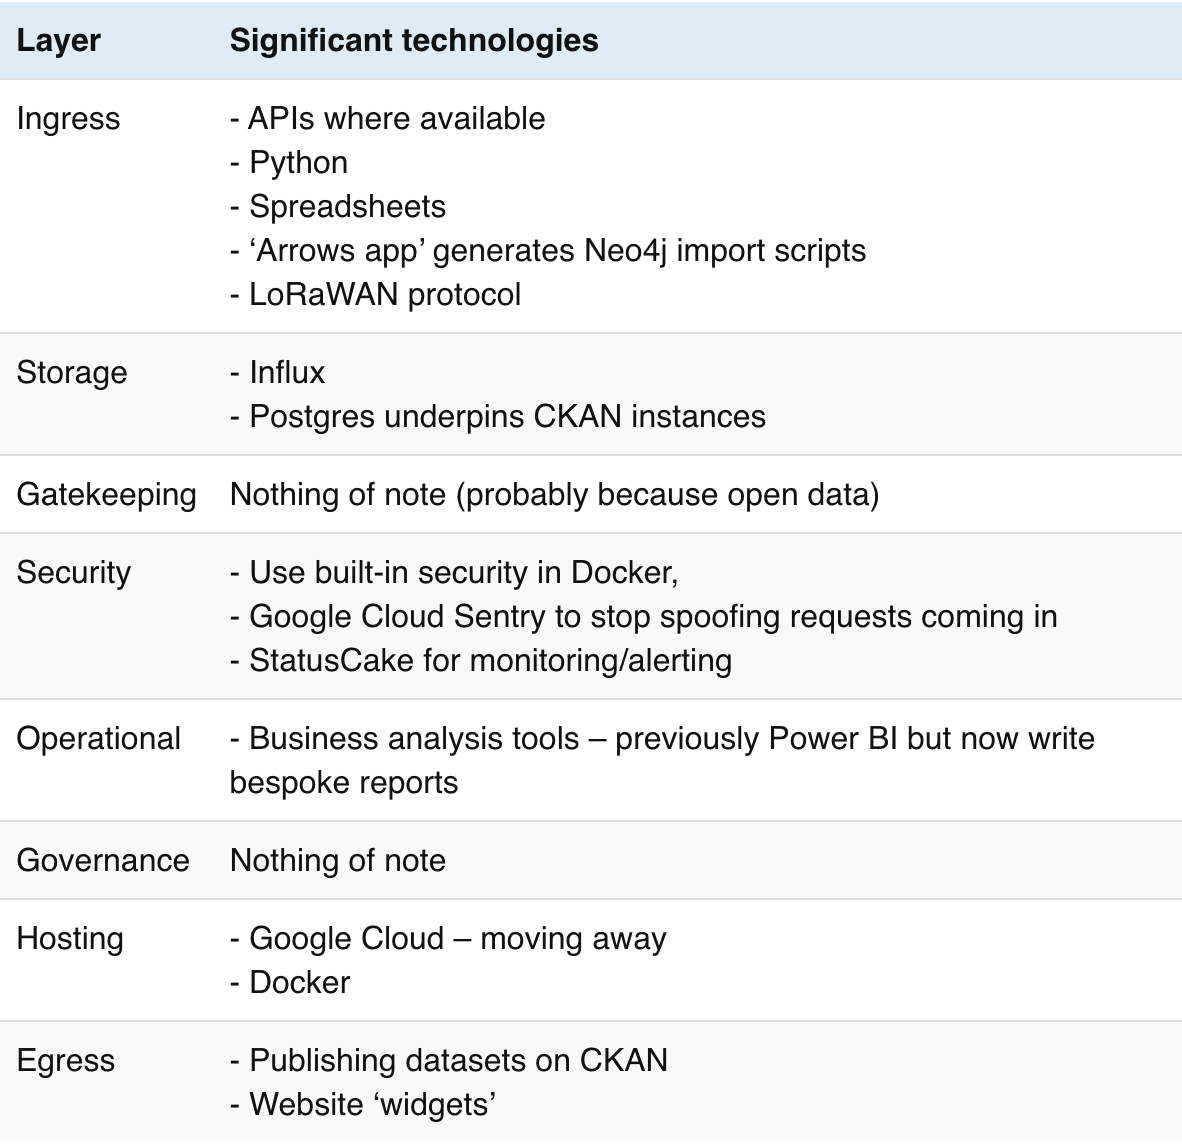
The Data Place
Stewardship role: Creating open datasets Category in Data Institutions Register: Infrastructure that supports data publishing Dataset archetype: Database / Sensor feed
Besides ‘data consultancy’ services, The Data Place’s core technical offering is data-hosting on behalf of clients. An instance of a CKAN database is run on Google Cloud and deployed using Kubernetes. JavaScript components will provide a clean interface between CKAN’s database APIs and a custom website for each client. Business requirements are evolving to favour platform flexibility over provisioning speed, so the team is transitioning the architecture to run in Docker containers that can run on any platform.
The Data Place’s other technical focus is as a partner building prototype applications for ‘smart cities’ using data streams from Internet of Things (IoT) sensors around the city. They intend to built a robust backend architecture for applications once they gain more experience in the LoRaWAN IOT protocol and learn by testing the limits of the prototyping technologies: currently Node-RED to fetch data, The Things Network gateway to connect devices, InfluxDB to store data streams and Grafana to visualise the insights.
In general, the technical team would consider well-established open-source technologies first, having had good experiences. Each application requires appropriate technologies, for example they are considering graph database Neo4j for a rewilding mapping project because it is better suited to the data model. All technology choices need to be considered alongside in-house skills and what is possible to find in the job market.
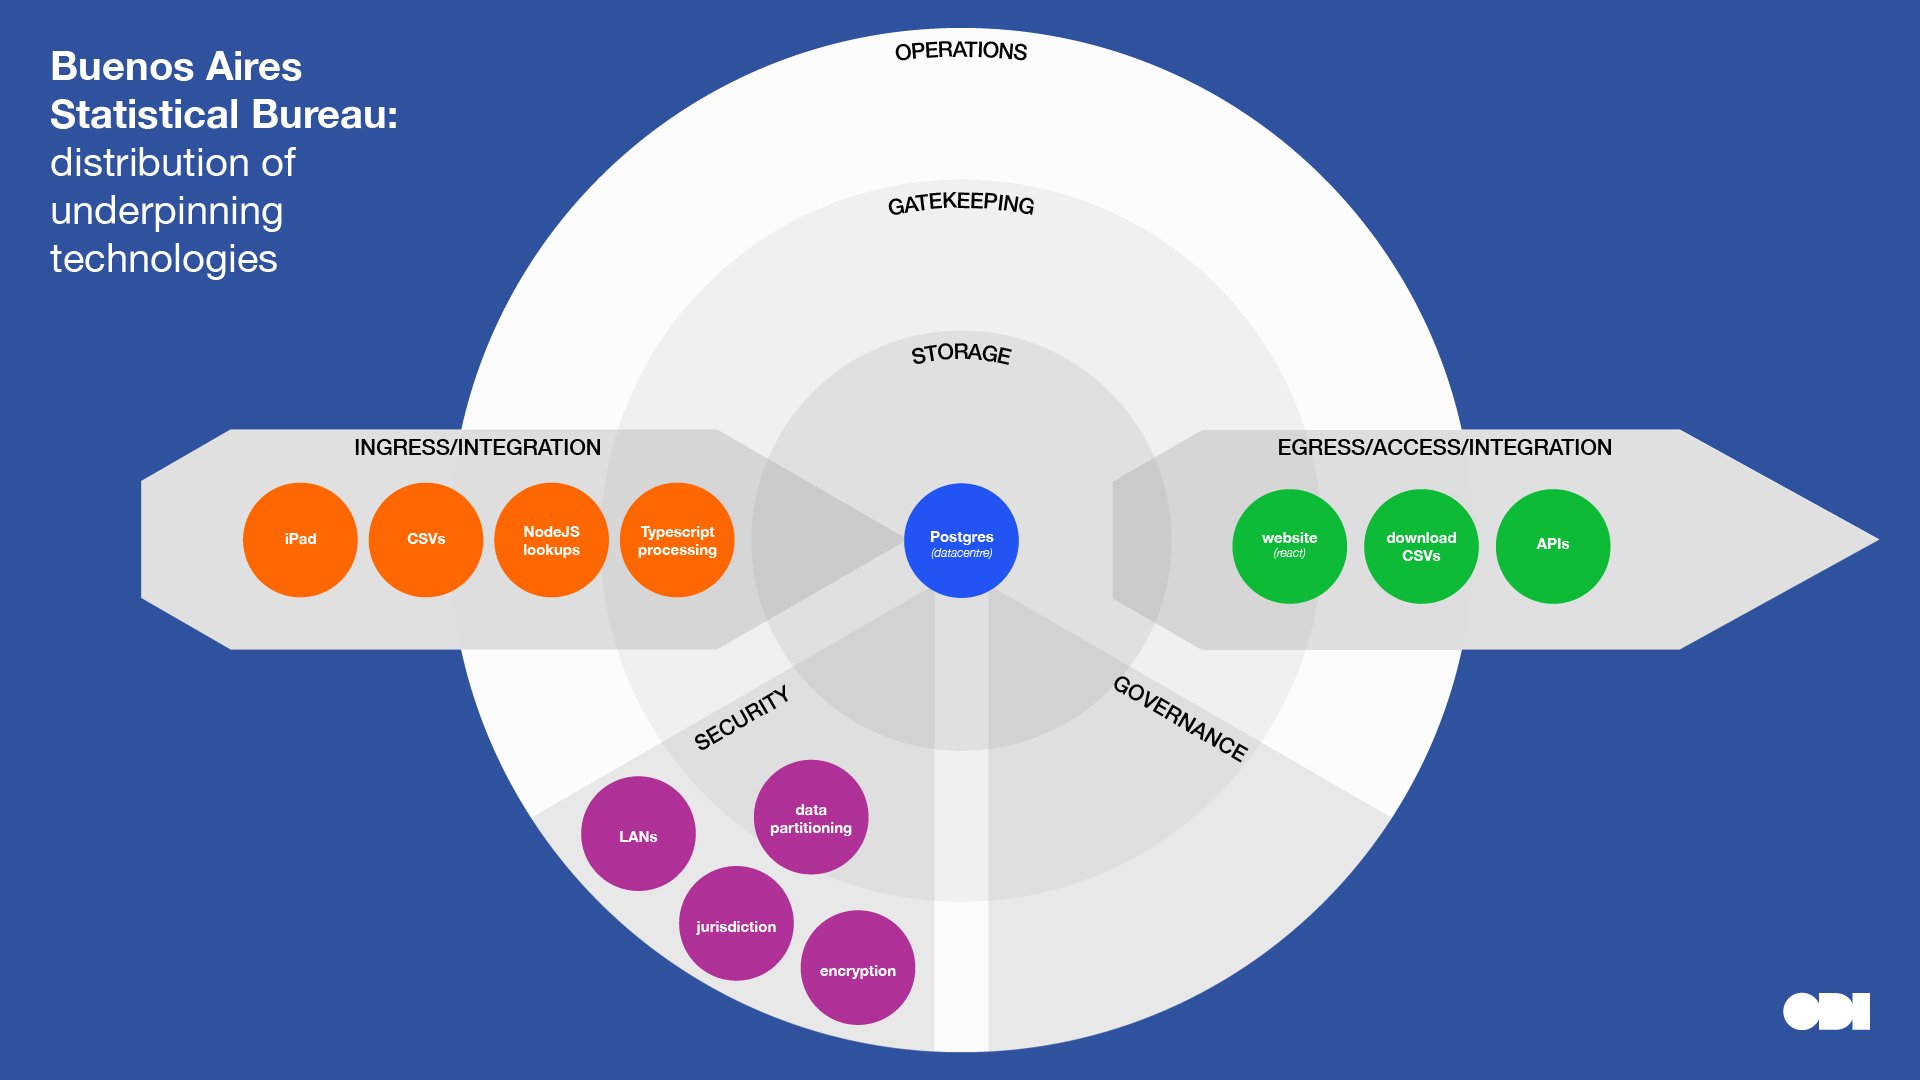
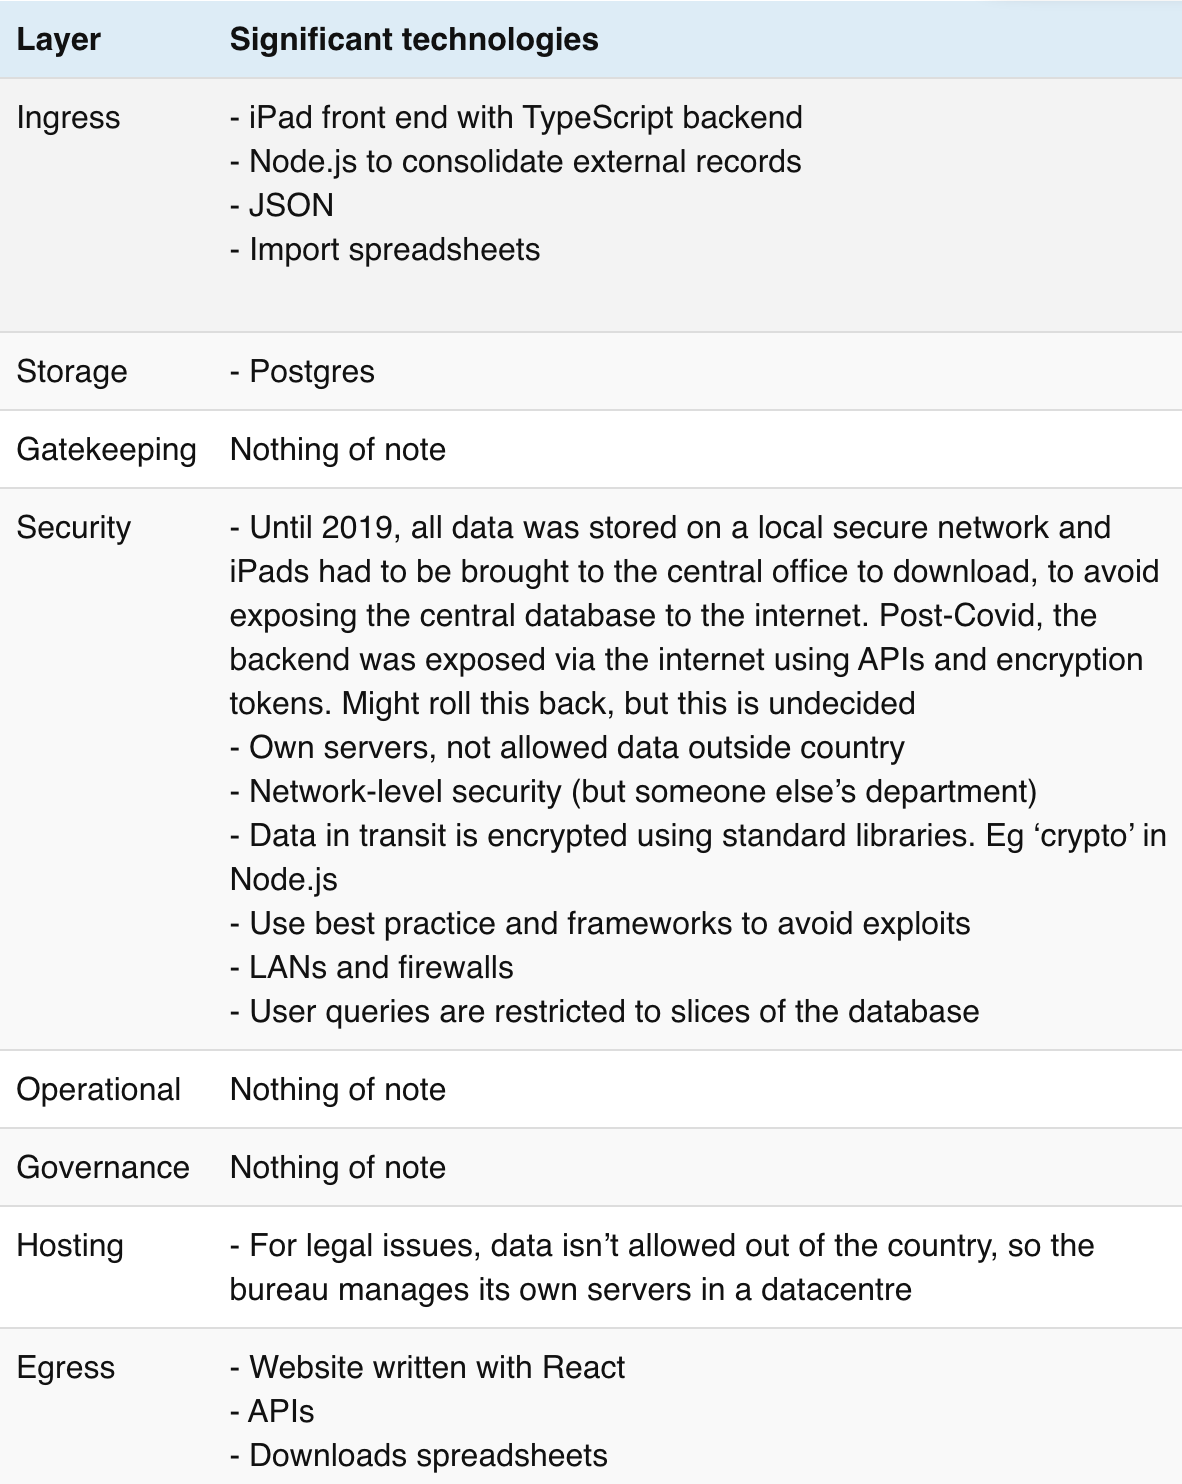
Buenos Aires Statistics Bureau
Stewardship role: Combining or linking data from multiple sources / Creating open datasets Category in Data Institutions Register: Singular national institutions Dataset archetype: Database / Statistical index
Buenos Aires Statistics Bureau collects, produces and disseminates the official statistics of the City of Buenos Aires. For example tracking situations relating to children, gender equality and care.
Researchers will survey citizens using iPads to collect responses. Responses are uploaded to a Node.js/TypeScript backend for processing and correlating with other datasources – themselves often imported from CSVs taken from the city’s open data portal.
Until recently, the iPads would be brought to an office and the contained data uploaded inside the local secure network to avoid exposing the database to the internet; protecting the integrity of the data by using network-level security. Being on-site was not possible during the Covid-19 lockdowns so the team introduced extra security using encryption tokens. Sandboxes, parsers, query validators and partitioned data slices further protect the data from corruption and interference.
It is important to gather data from citizens in any form they can, without barriers. Afterwards, much of the technical effort is spent improving the data quality by running bespoke scripts directly against the database.
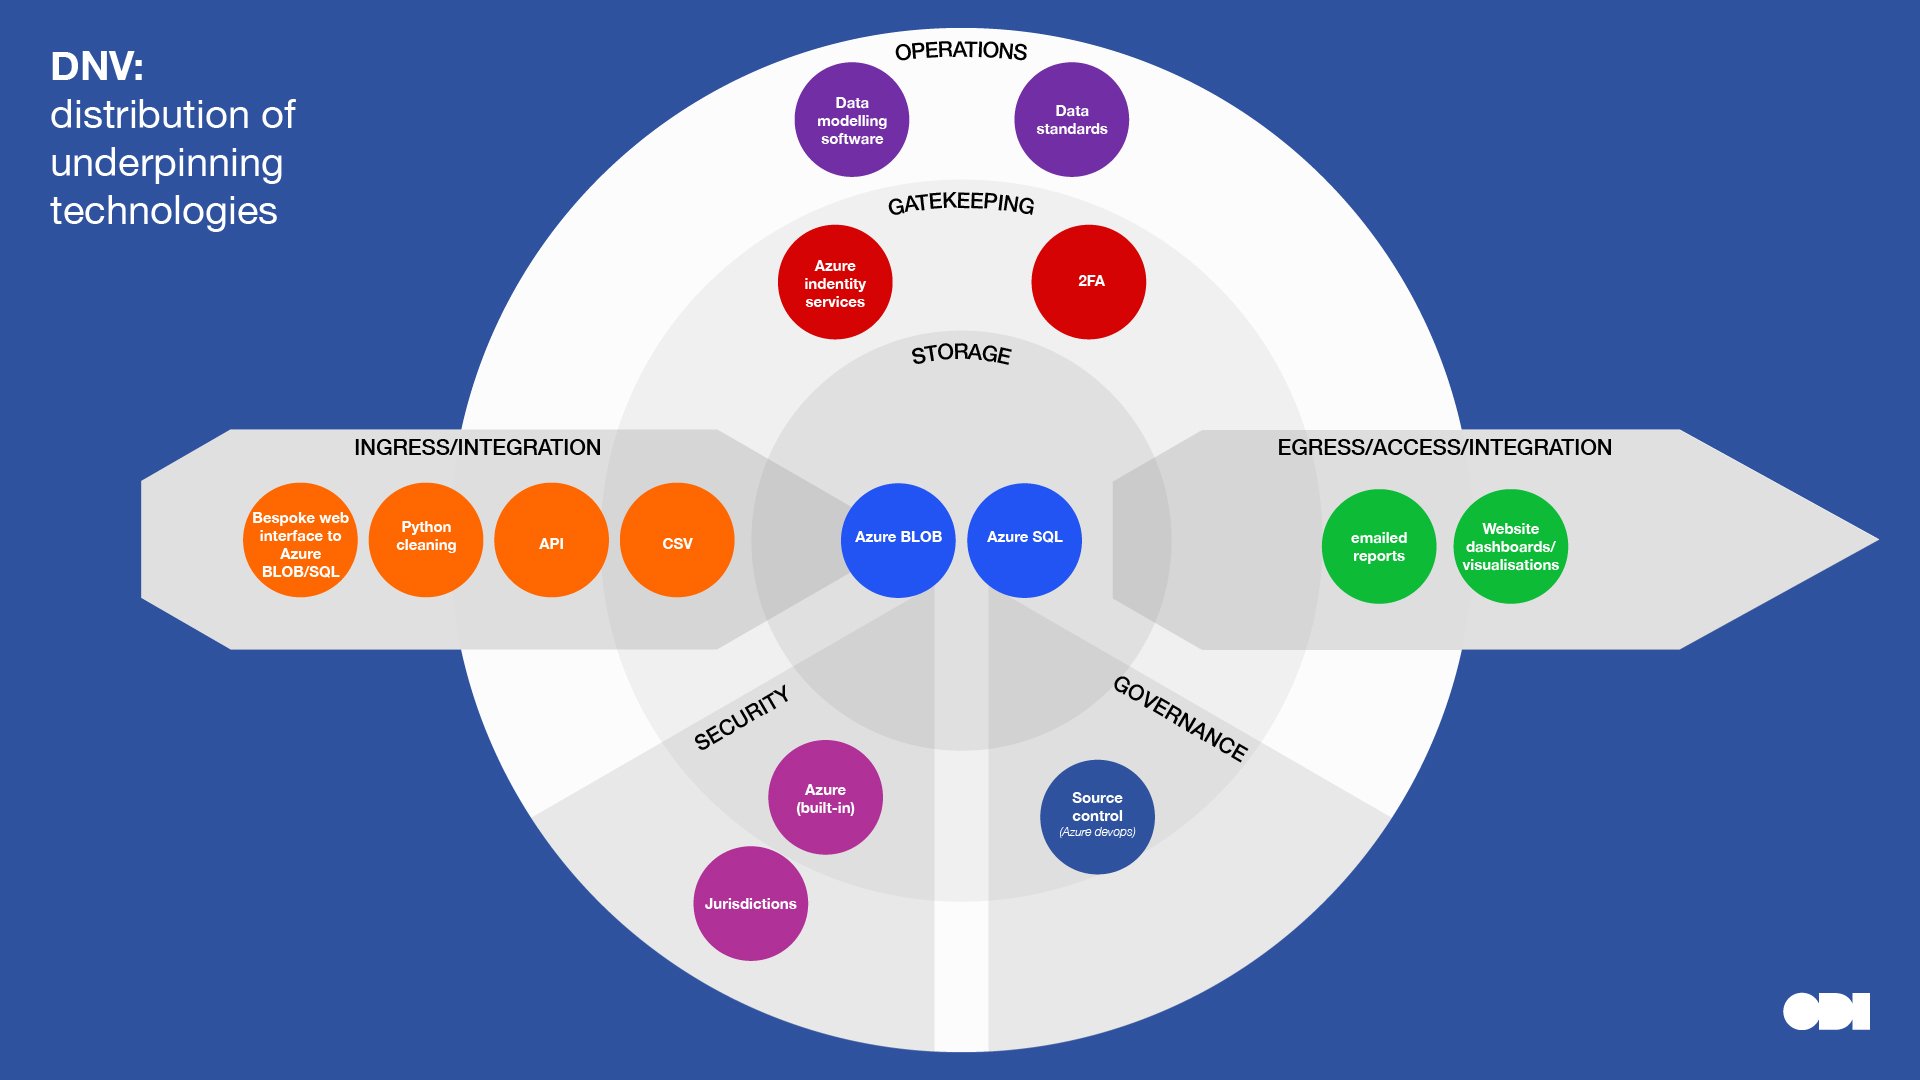
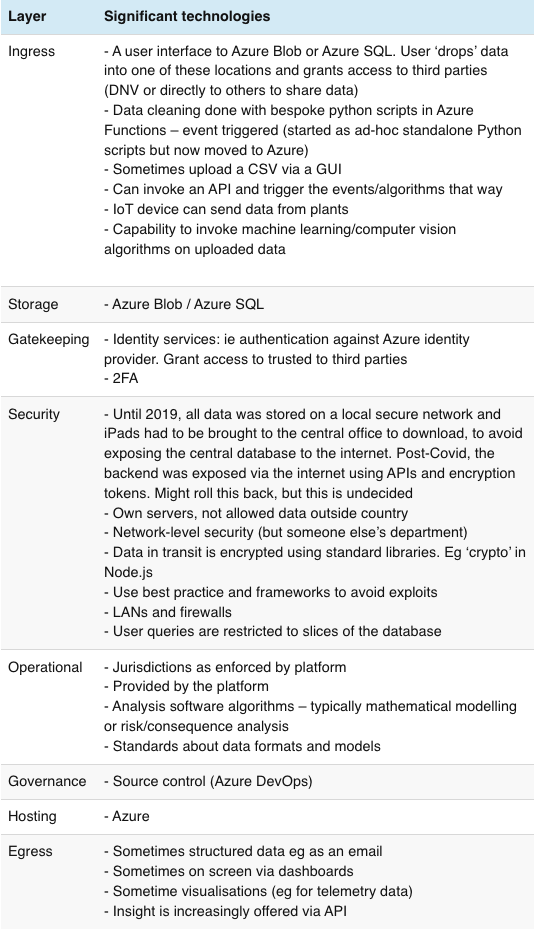
DNV
Stewardship role: Combining or linking data from multiple sources Category in Data Institutions Register: Data hub/ Repo / Sector regulator relationships Dataset archetype: Database
DNV’s technologies enable two purposes that directly relate to data access:
- Act as trusted broker between providers of maritime, energy or utility data – typically data that is relatable to physical offshore or onshore assets; environmental/meteorological conditions; or infrastructure (eg ocean based pipes, platforms, turbines) and those monitoring and improving the safety and efficiency of infrastructure, such as owners, operators or regulators
- Provide technical infrastructure to share data between clients who don’t perhaps have, or want to build, their own systems
DNV’s infrastructure and services are deployed and run entirely on the Microsoft Azure platform. Using a platform-as-a-service enables it to use in-built security, and advanced composable features such as automatic scaling, identity management and two-factor authentication.
As expected for a data intermediary, DNV uses various technologies for fetching data from many sources, and provides many options to report and onwardly share data. It is transitioning away from being data custodians, instead providing tools to read, manipulate and analyse data without the need for storage.
DNV provides many services, but its main product ‘Veracity Data Fabric’ allows clients to upload and grant access to data in a range of formats, from spreadsheets to real-time streams, using a web interface. The data stays in secure Azure storage for data processing. Bespoke Python scripts are triggered on the event of an upload; producing analysis, reports and benchmarking. The results of calculations are displayed or emailed back to the user. Finally, the data is deleted using Python scripts.
The following general insights surfaced during discussions about technology development and use within each organisation. These insights could form the basis of general advice and recommendations, but again it is a small sample so are offered here as food for thought:
- There are many ways of achieving the same thing. Common requirements produce similar technologies that do the same thing. For example most programming languages can produce websites or fetch data from remote systems, and there are many competing relational databases or tools for data analysis. Web technologies such as APIs can bridge different systems and reduce the impact of differences.
- There is no perfect system. We encountered some embarrassment from organisations in having made what seems in hindsight ‘naive’ decisions, having made decisions under pressure, or for using simple or ‘low-tech’ solutions. But pragmatic decisions are based on the circumstances, resources and knowledge at a point in time. Organisations will evolve away from some solutions and towards others.
- Technical systems always evolve. The decisions made in the early days won’t be applicable to the same organisation at different scales or when priorities change. There is no shame in this. However, systems developed as a ‘proof of concept’ have a habit of becoming permanent. Scale seems to be the most significant driver to change the technology, whether volume of data, number of connections or requests for access. Organisations can anticipate by planning, and budgeting, to evolve technology in their business plans and ongoing strategy.
- Cloud hosting is a double edged sword. The majority of interviewees are using ‘Platform/Infrastructure as a Service’ providers such as Amazon’s AWS or Microsoft Azure. Resource-strapped teams are taking advantage of off-the-shelf advanced technologies, scaling flexibility, integrated security, and connected services such as databases. This seems to lead to mental models of interacting services rather than traditional ‘system design’ of physical servers and network layers, and indeed requires different specialist skills. Despite many advantages, the trustworthiness of suppliers is under constant review and in some cases considered risky enough to retain infrastructure ‘on premises’ for greater long-term certainty, control and assurance.
- Storage isn’t the biggest decision or investment. Data processing pipelines, system integrations and skills are.
- Skills are as important as technology. Some lasting technical choices are simply due to foundational employees’ early experiences. Technical specialists – such as cloud infrastructure, ‘big data’, ‘DevOps’ or UI/UX experts – free up (often founding) domain specialists to focus on more strategic work. However people with specialist technical skills are expensive and in short supply. In the early days, organisations need technical generalists and as the company grows they need specialists. Both are expensive.
- The technologies used by other ecosystem actors seem not to have much of an influence on the decisions of organisations we interviewed. This may be because API integrations and processing pipelines can translate between systems, and therefore liberate organisations to make independent choices.
- Provider APIs aren’t as universally prevalent as expected. Many data providers are transitioning to APIs which can unlock value in the data ecosystem, but the data users we spoke to are used to working with many means of accessing data.
- Semi-manual processes are legitimate ways to bridge technology gaps while the company matures. It is not unusual to create or interact with data manually, particularly during exploratory phases, or until processes mature and can be automated.
- There are many different reasons for using open source solutions. These include budgetary, ideological, previous unfavourable experiences with proprietary ‘over-promised’ solutions, and an acquired trust in the quality and stability of long-running open source projects.
- Technology enables people, it connects people, and it needs to be usable. No technical fix will solve all problems.
Till next time...
We are grateful to the data institutions we interviewed for giving their time to speak to us and hope it will be interesting for them to see themselves represented in this way.
We spoke to organisations representing only three of the six stewardship roles. We’d love to speak to more, especially those that are protecting sensitive data; maintaining infrastructure such as identifiers or standards; or enabling people to take a more active role in stewarding data about themselves. It’s too soon to tell yet if there are archetypes, or general rules of thumb when it comes to technology choices, but each conversation deepens our knowledge. If you would like to discuss the technologies you use to steward data, please get in touch. We’ve been told the conversation is even quite therapeutic!
We’d also love to hear if you’d like to use the prototype ‘technical layers’ worksheet, and have suggestions to improve it.