
By Rachel Wilson, Senior Software Developer at the ODI
Weeknotes: personal reflections from the ODI research team. Keeping you informed about our projects, research and decision-making processes.
This week's activities
- Buying hardware
- Building a physical and digital twin of a building management system (BMS)
- Experimenting with visual communication
- Publishing the weeknotes
This week's observations
- A picture doesn't really paint a thousand words. You need both. A picture recalls a thousand words perhaps.
- You learn more by getting something wrong, and assumptions are quickly confounded by reality
- Things change with scale
- Making decisions forces you to confront the things you had assumptions about but didn't fully understand
Lightbulbs and 12 volts and "mosfets" oh my!
I had thought, naively, that some prior tinkering with Arduino projects and some basic circuitry from Physics class meant that I'd be capable of connecting some components together. How hard could it be? I will spare you the details of my learning curve but suffice to say - working with 12v is VERY different from working with 3.3v, and there are a LOT of different lightbulb standards, power, connector, wire safety and sensor configuration options out there to achieve the same thing. My initial power readings were crazy because I didn't understand grounding across multiple boards; product datasheets seem to require degree level physics; and I blew up two power sensors by grounding them incorrectly.
The worst that happens when I write wrong code is incorrect values, or nothing happens at all - stuff doesn't blow up, or set fire! Nothing these past weeks were what I expected.
But I was reminded that:
- There is nearly always more than one way of achieving something
- You learn more by getting something wrong than following instructions and getting it right first time
- People will help you, especially if you demonstrate you have done your research
- Assumptions are quickly confounded. If I were to write about how I imagined the system would turn out I would have remained wrong
And what I learned was
- Actually *doing* - and buying things - forced me to confront all the fuzzy areas I didn't fully understand, which were permitted to stay fuzzy in my head. But at the point I had to make a choice or a decision, I had to understand.
- The technologies and approaches might change at scale, but the essentials don't: power is just power, data is still data. The "topology" of the interactions and the content of the data remained the same.
A BMS Twin - ta da!
Perhaps it doesn't look like a building management system, but, just imagine the wires are muuuuch longer.
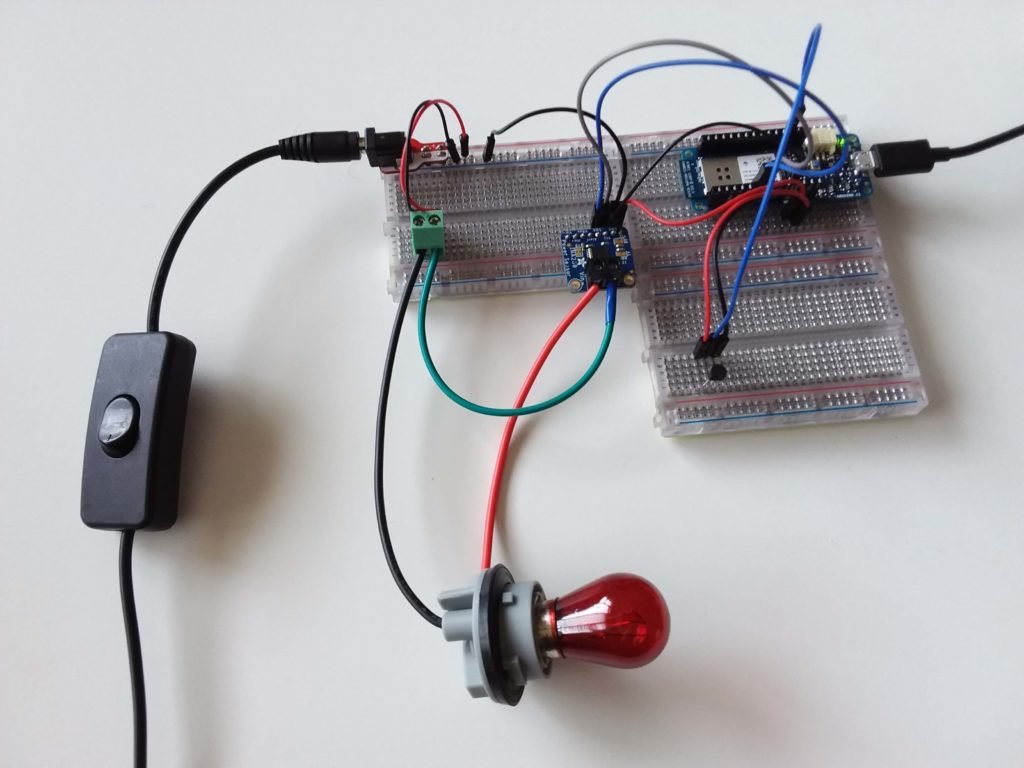
I've updated the breadboards and wires so that they won't set on fire at 12v. The red wires are power, black is ground, the blue wires are carrying data. The components connected by blue wires are a temperature and power sensor. The filament lightbulb uses power and gives out enough heat to represent a radiator. A manual switch controls the "heating".
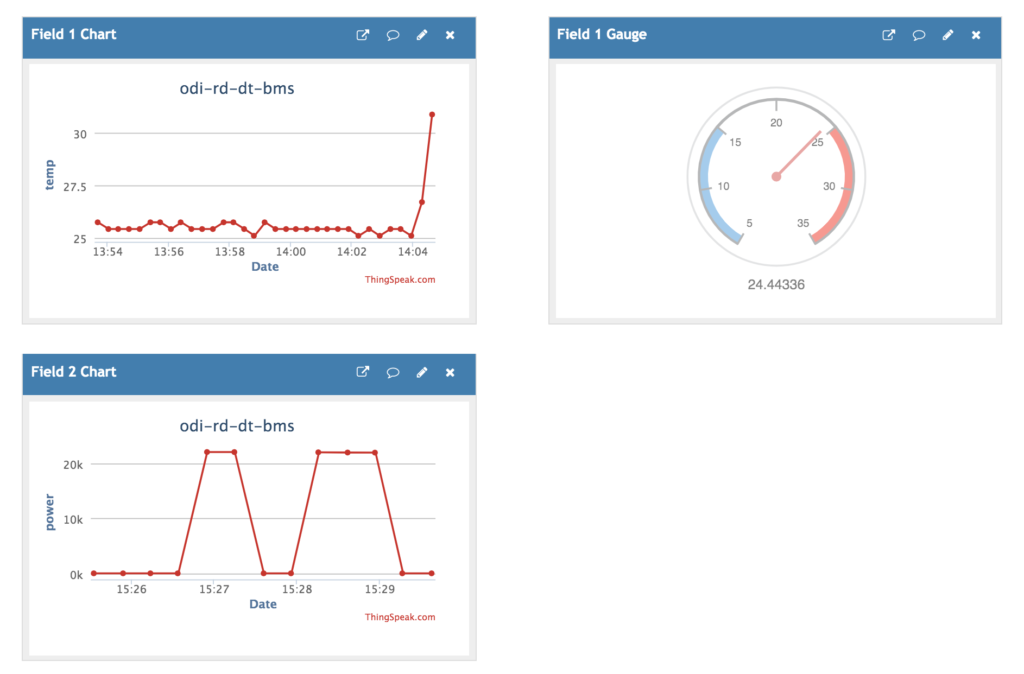
The Arduino micro-controller (top right) is programmed to take sensor readings every 20 seconds. The power sensor records how much power is used by the "heating" when it is on. When the heating bulb is near enough to the temperature sensor it detects the change in air temperature as you can see by the rising graph.
The online ThingSpeak service provides us with the digital half of the twin: data storage, graph visualisations of the readings, and an API as a way to connect to the data. We could easily send readings to our own database and use any graph software package, or write our own, to provide a similar visualisation.
We can imagine this system inside a house (a doll's house?) and a real world buildings maintenance team. If we made an intervention to add insulation to the house we could verify - via the data and visualisations - whether the system maintains the same temperature with less heating power.
We can imagine switching the power to use a different source - at the moment it comes from a 12v power supply - but it could equally be a battery, a solar panel, or a district heating network.
Visual communication
Thinking ahead to connecting twins, I shared the diagrams from weeknote 3 with my team, but they gave me blank looks - unsurprisingly. It was clearly not a useful diagram for communication. Spontaneously I sketched the following based on our colourful diagram of the flow around a digital twin and it was much clearer:
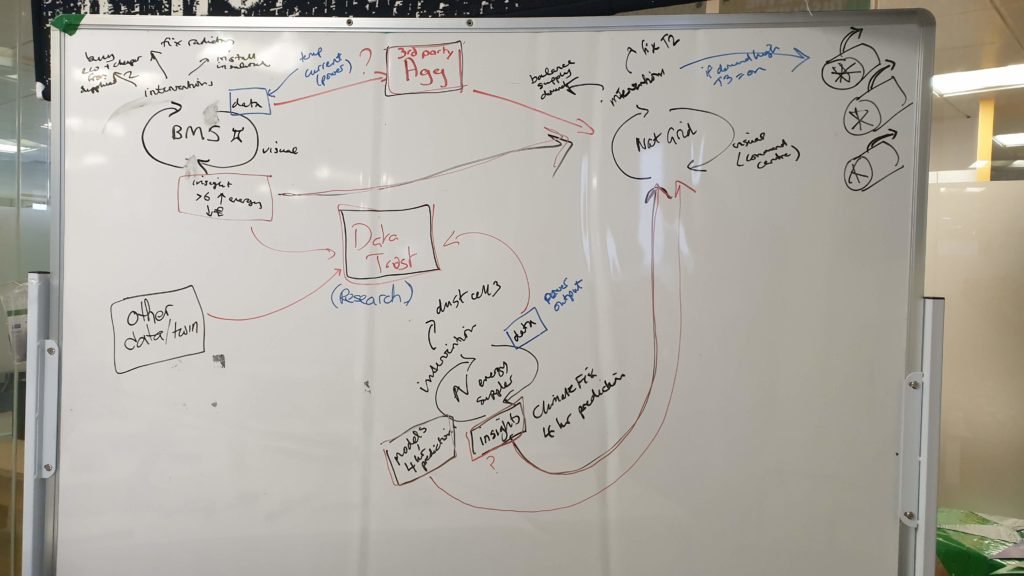
The yin/yang-style representation of a digital twin is something we've been using as a narrative device to explain the relationship between the physical and digital halves. I'm pleased that the same diagram also serves as analysis and communication tool. Used in this way I have the image of a spinning galaxy, throwing off data instead of stars.
I'm interested in visual communication. Marina, our engagement manager, has been reading this book about non-verbal techniques which is now on my reading list. I wonder, how many diagrams can be understood immediately without an accompanying explanation? I'd love to know the thresholds and tradeoffs for comprehension. Why aren't more diagrams videos? Thinking about it, I never click on videos, perhaps that's why. But perhaps they could be animated GIFS?
Weeknotes have a home
This week we were exploring where best to publish these weeknotes (of course they're being published retrospectively so this might seem like an odd statement). Medium, Github pages, and another dedicated Wordpress site have disadvantages for our needs. So for the first time on the ODI website we're experimenting with a dedicated space for Weeknotes.
We'd really love to hear what you think of them: Are they interesting? Are they useful? How could they be better? Would you like to see more/less of them? How do they compare to our other finished, polished outputs in terms of interest, comprehension, usefulness?
Reading List
Adafruit INA260 Current + Voltage + Power Sensor
What's The Difference Between Shunt, Bus, and Load Voltages
System trade-offs for high- and low-side current measurements
An Introduction to Ground: Earth Ground, Common Ground, Analog Ground, and Digital Ground
Reflections
- This stage has taken more time than I'd (naively) hoped. Despite learning a lot I think I will have to adjust my ambitions for this particular twin prototype. I had hoped to partner with team mate Fionntán to introduce a basic machine learning model; develop a bespoke control interface; or bring the hardware to life with a 3D rendering like the Samsung project did.
- Instead I decide to park the hardware for a while, and explore ways this twin might connect to another
This week I am powered by: Physics Thank you to: Stefan from Bare Conductive, for generously helping a beginner. Everyone remembers a patient teacher.