
Our report, Show me the money provides the most comprehensive snapshot to date of the UK peer-to-peer lending (P2P) market. Using data from the three biggest P2P platforms in the UK (Zopa, RateSetter and Funding Circle) we highlight the regional geography of lending in the UK. This is the first time anyone has published financial data with an open data certificate.
Regions in the South lend more but the UK is surprisingly balanced when it comes to recipients
Key differences in UK regional activity from the report include:
- Scotland, the North East and the North West have similar statistics for pounds received per person.
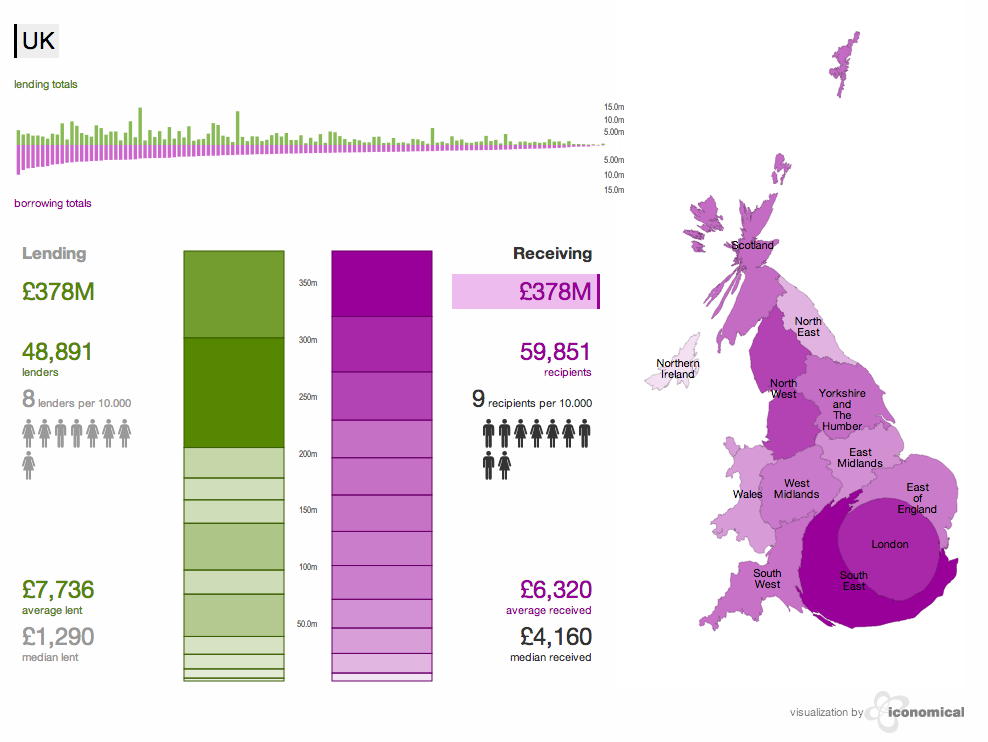
- There is substantially more lending in London and the South of the UK but recipients are evenly distributed across the country.
- Four regions invest more than they receive. All four - London, South East, South West and the East of England - are in the South of the UK.
- The range of lending per person ranges from £1.40 to £11.80 between UK regions, whereas the range for recipients only varies between £3.90 and £7.30 per person.
Some quick stats from the report:
The unit of analysis is a loan part. A recipient who takes out a loan of, for example,£5,000 may receive the money from hundreds of different lenders. Vice versa, a lender may subdivide her investment into many loans. A typical (median) amount for a loan part is £10. However, in a small number of cases the investment per loan part is substantially larger.
An interactive visualisation with the consumer in mind
One reason for opening up this data is to build consumers' trust by being transparent. We also wanted to give individuals a way of exploring this vast data set. The visualisation allows you to drill into a specific region of the UK and compare it to the rest of the country. As the data derives from individuals, it is of course personal data. However, we went to great length, including carrying out a small-scale privacy impact assessment,to protect people's privacy.
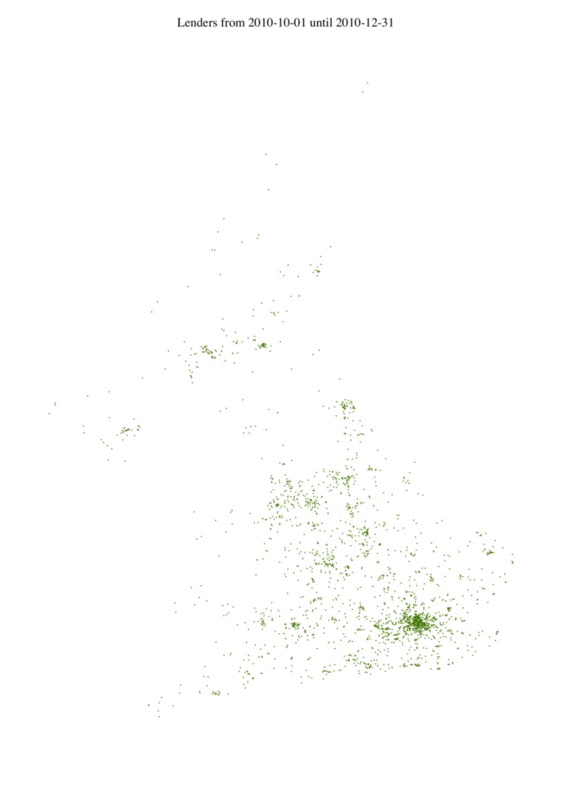
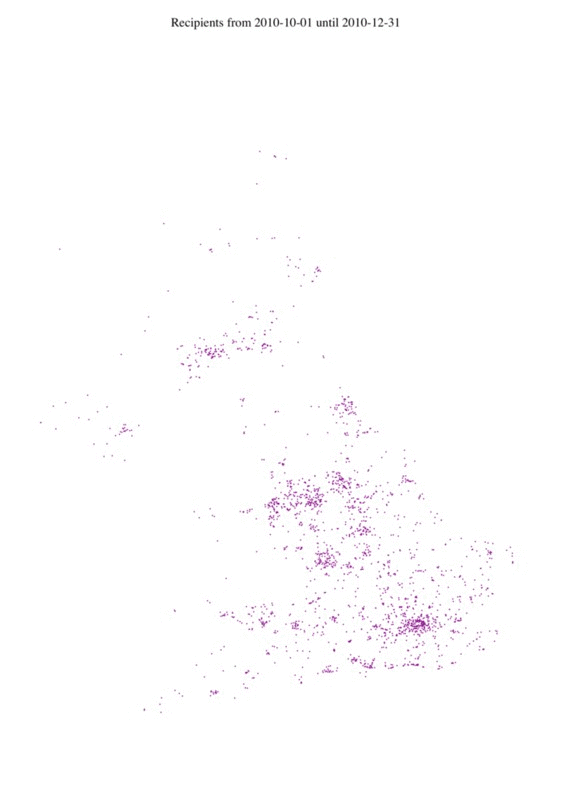
Growth in the market is expected to continue
P2P lending has been growing rapidly over the last few years. The visualisations below show how more and more people joined the market either as lenders or recipients. Each dot represents an individual.
Towards a real-time map of the financial market
A broader lesson from this project is that publishing this sort of granular financial data is possible. We demonstrate here how to publish open data and how to make it accessible. In sum this project is a step toward a more publicly transparent and comprehensive mapping of the financial system. Eventually we hope this map will become updated in real-time with data feeds directly sourced from P2P platforms and other financial markets. Go on and have a play – show yourself the money!