
By Rachel Wilson, Senior Software Developer at the ODI
Weeknotes: personal reflections from the ODI research team. Keeping you informed about our projects, research and decision-making processes.
This week's activities / questions
- What is the simplest digital twin?
- Connecting a sensor to the internet
This week's observations
- A digital twin can be stripped back to a few essentials and still be useful
- Data output by sensors is very raw: measurements with no sense of time
- Actuators (and therefore interventions) are very simple state changes
- Interventions don't need to be automated
- Remember to go back to the brief when you feel lost in possibilities
Re-finding the path
Having spent a few weeks researching the complexities of digital twins in the real world I feel like I've got a bit lost. I want to focus on producing something helpful for the project, so I go back to the brief: The research question, our understanding about the audience, our alpha plan, and delivery timelines.
How can digital twins connect and interact with each other? How can the Gemini Principles inform which of these models, in which scenarios, best support a better built infrastructure and its national digital twin?
This reminds myself that it is the connections that are most interesting, so I'd like to get to that as soon as possible. So that for the first iteration I only need to build the two simplest twins that we can connect together. Our expectation is that twins will mostly connect through the data they share, as opposed to physical connections. So before we can think about how twins connect we need to understand the interaction points and the data that a twin creates.
The simplest complete digital twin system
Our fabulous graphic designer Caley produced this super image which summarises our current working definition of a Digital Twin.
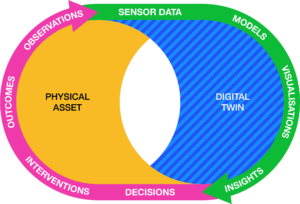
It depicts how a Digital Twin system comprises two halves: a physical asset, and a virtual representation - the digital twin. [I'm still unsure if we should call only the virtual side the digital twin, or whether that term should be reserved for the complete system...]. The physical asset may be complemented with sensors and actuators. The actuators are things we can control, either programatically or manually, which change the properties of the physical asset or its environment. We take measurements, potentially using sensors, to observe its state before and after the actuators have acted on it.
Insights may emerge from visualisations or model predictions, based on data about the physical asset or its environment. If those insights result in decisions to change (by intervention) the asset or its environment, then the virtual representation should update to reflect the outcome. For example, we can observe the new state via current sensor readings; or we could manually update the visualisation with new details as soon as we observe them.
Let's take a tour around the system to investigate minimum solutions.
Data: Some way to take measurements, and record them electronically are necessary. Perhaps the data capture does not need to be automated - we could survey equipment manually - but I'd like to demonstrate something that evokes an industrial context asap, so I will use sensors. Visualisations and Models: Some kind of visualisation of the raw data is necessary to generate insights. Although it could be as simple as a list of numbers, or a graph. A predictive model is not necessary to generate insight. Interventions: Interventions are the result of decisions but neither need to be automated: in the case of a building management system we might make an intervention to insulate a block of flats, or deliver leaflets asking people to turn their heating down at night. When an intervention is automated the visualisation can double as an interface to trigger an intervention (think of Mozilla Gateway and changing a bulb's colour), but it is not necessary; we could pull a mechanical lever. As the system becomes more automated the interconnection between the physical and the digital is more closely integrated, it sometimes becomes hard to separate them. Outcomes and Observations: if we use sensors to measure the results of the intervention then outcomes and observations appear to come for free.
So, all that is necessary for the first prototype is: Some data, a simple visualisation, and an intervention - which can be manual. This seems much more manageable.
A sketch of what I might build
Going back to the use case we sketched with OpenClimateFix and Imperial: I'll need to model a building management system (BMS) with readings of temperature and power consumption; a solar farm with power output; and possibly some national grid turbines.
I need to decide what parts to order! So I made a sketch. It helped me think (a) how I might represent the assets using small, affordable prototyping components and (b) possible data inputs and outputs.
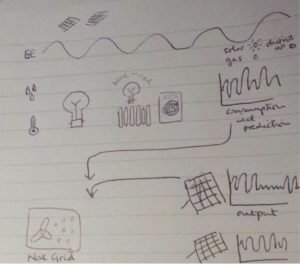
- The top row represents fluctuating costs of energy. Depending on current costs an algorithms could choose to buy energy from gas/coal power stations, use the district heat network or use a renewable option.
- Next row represents temperature, humidity measurements in a dwelling, and some objects that use energy - the output would be power consumption and perhaps a prediction for the national grid
- Bottom right is the power output and predictions from separate solar farms
- Bottom left is the National Grid. The little circles are because I imagine a fan - representing a turbine - being switched on to jiggle coloured balls around, like a children's vacuum toy :)
The shopping list
Some hours of internet searching later and this is my wish-list
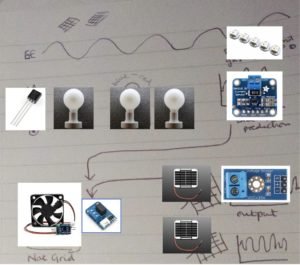
Data: Tiny, cheap solar panels are surprisingly easy to find. So are sensors for temperature and power consumption. As far as energy use is concerned I realised that a lightbulb, heater or an appliance all look the same to the sensors - they all use power in watts. So I can use a lightbulb to represent all appliances. Intervention: I looked at heating elements to heat my "room" but then realised that filament bulbs should get hot enough to be detected by a nearby temperature sensor, as well as producing a visual effect Outcomes: I can represent turning-on-an-extra-turbine using a fan controlled by a relay; and the decision to buy energy from different sources with an LED array. Visualisation: There are many options for this which I'll explore in a future weeknote
Connecting a sensor to the internet
To accelerate my introduction to circuitry I bought an Arduino MKR1000 IoT kit which comes with all the correct components and a tutorial to monitor a plant's environment with a temperature sensor and send readings to the ThingSpeak web service using the MKR1000's built-in wifi chip. Ideal.
[insert circuit building / coding montage] And here it is, I feel like a proud parent.
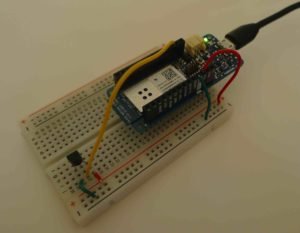
If you recall your circuitry from GCSE physics... The red wires provide power to the sensor; the green is the ground wire completing the circuit; and the yellow wire carries the temperature reading as data.
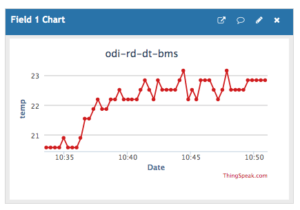
Data is posted to ThingSpeak which I'm using for its simple cloud-hosted data storage and visualisation. You can see when I turned my heating on at home, just after 10:35.
When making this very simple initial prototype I noticed
- The sensor data is very raw - only numbers without scale or unit. In fact the data is a voltage reading that needs to be converted into a meaningful value before we store it
- With very few components, and simple off-the-shelf data storage/visualisation, we can already observe insights about behaviour and feedback loops.
- It is the ThingSpeak service that adds the timestamp when it receives a reading. Without the timestamp - without a memory - the readings would probably not lead to any insight. What would the Zen masters make of digital twins...
Reading List
- Getting started with the Arduino MKR1000
- Plant Communicator
- About the I2C Protocol
- Helpful forum question about calibration question - Strange results from TMP36 Thermistor
Reflections
- I'm surprised how stripped back a digital twin can be and still be useful
- I'd like to say it was simple assembling the hardware, but it wasn't plain sailing. Eg. I first connected the power to the wrong output and the temperature reading rocketed to 118 degrees and I burned my finger in the process; The temperature reading doesn't seem calibrated despite the datasheet's specifications; The tutorial was missing an important line to initialise the ThingSpeak library. Even though I'm a software developer, I'm not used to dealing in physics. The learning curve even to get this far as been surprisingly steep and I don't know how much to share in these weeknotes.
- I have been thinking a lot about interventions and their relationship to visualisations: Can all interventions be boiled down to either an on/off state change, or to increase/decrease some value - the same way a user interface consists of very simple components such as radio buttons, checkboxes and sliders?
- This first prototype is built using IoT components; is the technology of IoT the same as in digital twins but at a different scale?
Today I am: Working from a friend's house in Crest in the south of France
I am powered by: fermented black tea, because I should have been more specific about pre-ordering "black tea for breakfast"
Thank you to: The 'Fablab' maker space in Crest